7 Sales Forecasting Examples for RevOps Leaders
Revenue operations is an ongoing process of anticipating and planning for your company’s financial future, and sales forecasting is integral to both. But no forecasting model will work for every business.
These sales forecasting examples will show you how to forecast revenue with different metrics and formulas.
By the end of this article, you’ll understand a range of sales forecasting methods and be able to use the data you have to project and plan for the future.
Why Is Sales Forecasting So Important For Revenue Operations?
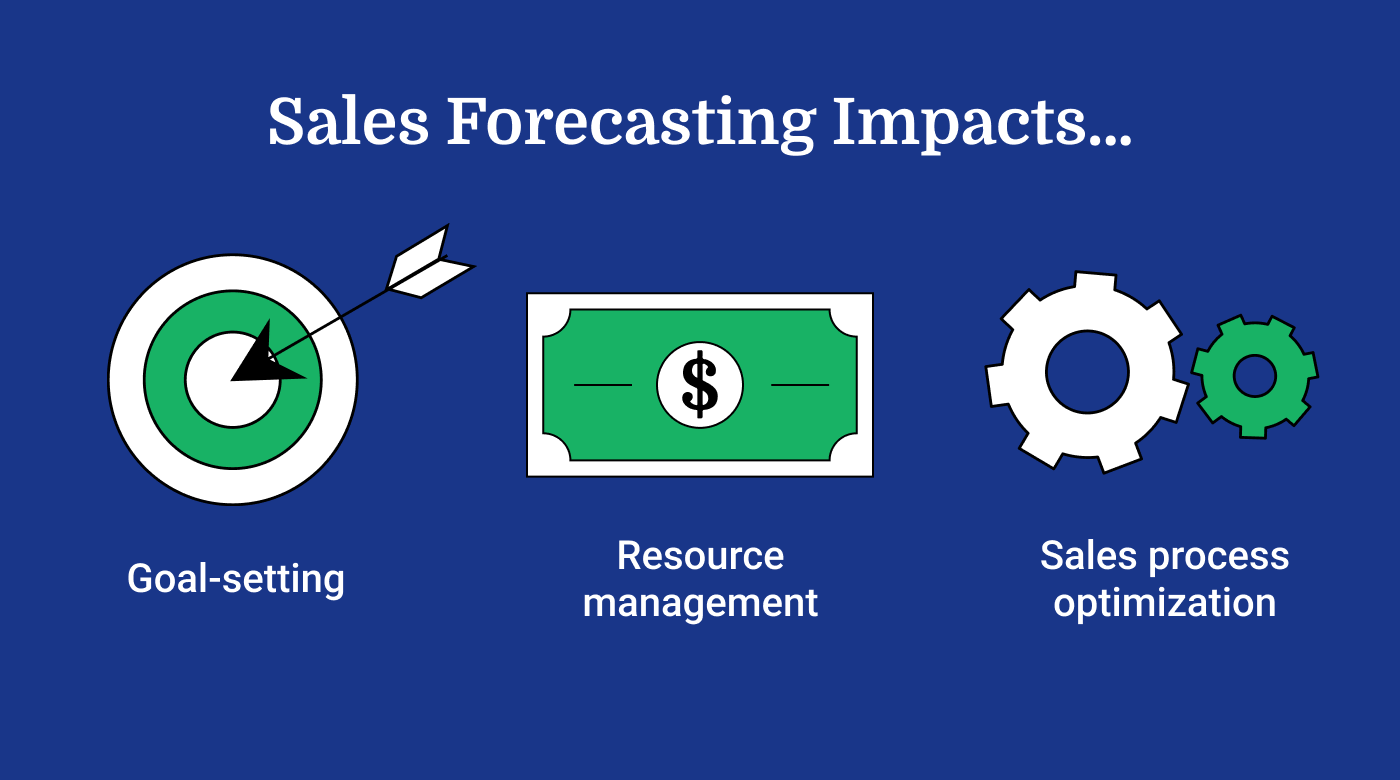
With all that sales teams have to accomplish, some colleagues might feel like forecasting is just another thing on the to-do list. But forecasting impacts the sales team, and the business, at many levels. Those sales projections help set expectations for a quarter or a year. They allow sales managers and their teams to set reasonable goals and quotas. Without data and forecasts, you can easily end up with goals that either don’t challenge sales reps or which demand the unattainable.
For RevOps teams, sales forecasts help you estimate not just revenue but also costs. When you have an idea of what your sales will be, it informs your hiring plans for sales, marketing, and customer success. Accurate sales forecasts allow you to take advantage of opportunities in the market by adjusting headcount, sales tools, and budgets.
Accurate sales forecasting is also a vital tool for helping businesses plan for significant growth, so having best sales forecasting practices is vital. For scaling SaaS companies or other startups, rapid growth might mean that last year’s numbers aren’t as helpful in planning for the next year. Accurate projections that incorporate new data and market research help growing companies know what to expect.
Sales forecasts can also be valuable for attracting investors and partners. Even if your company is currently very small, forecasts based on meaningful data can help communicate your organization’s potential.
Finally, forecasting is important for assessing and reassessing your sales process. You can see whether your forecasts are accurate to test your assumptions about win probability and other metrics.
Even when it goes astray, sales forecasting can lead to process improvements. For example, let’s say your actual sales revenues fall short of your projections. You can then compare each step of the process to find out why. Perhaps you collected the expected number of leads, but your win rate was lower than expected. Now you know that you need to either adjust your forecasting calculations or find ways to boost your win rate.
The needs and expectations of your customers are constantly evolving, so you may find that your sales operations need to evolve as well. When your forecasts don’t align with your results, it’s time to evaluate why.
7 Sales Forecasting Examples
I chose these examples of the best sales forecasting methods. I’ll cover what information the forecast uses and the benefits and drawbacks of each approach.

1. Intuitive sales forecasting
As its name suggests, Intuitive sales forecasting depends on the opinions and subjective estimations of your sales team.
How it works
In intuitive forecasting, a RevOps leader will ask their sales teams to quantify the likelihood of winning the opportunities they're currently working on. In its absolute simplest form, you could create an intuitive forecast by asking each sales representative how much they believe they will deliver in a sales quarter or year. Then you simply add up these intuitive estimations to create an overall sales forecast.
For a slightly more detailed estimation, you could also ask each sales rep to combine two estimations:
- How much revenue the deal will generate (in dollars)
- How likely it is that they will close the deal in a given time period (as a percentage)
You can then multiply the likelihood of winning by the size of the deal. You perform this calculation for each deal and add the numbers up to estimate that person’s anticipated sales.
Each sales representative will make these judgments for each opportunity they are responsible for. You can then aggregate the value and likelihood of each deal to forecast sales by individual reps and the sales team as a whole.
Intuitive sales forecasting example
Let’s say that you have five sales reps, and you ask each of them how much they will sell by the end of the quarter. Each team member sends you their best estimate, and you get the following numbers:

You then add these numbers to generate the sales forecast for that quarter: $460,000.
If you wanted to take a closer look at each deal, you would ask each rep to estimate individual deal sizes and the likelihood of closing them this quarter. We’ll look at one team member’s deals as an example.

You would do the same calculations for each sales rep’s opportunities and then add their total projected sales to create an overall sales forecast.
Pros
- Allows new companies with minimal historical data to forecast sales
- Asks for input from sales reps working directly on deals
Cons
- Based on opinions, not data
- Requires knowledgeable, experienced sales teams
2. Historical forecasting
Historical sales forecasting is based on the principle that past performance is the best predictor of future performance. It uses actual sales data from previous quarters or years to forecast future revenue.
How it works
We use historical data to forecast all the time. When we need to buy something, we often base our cost expectations on the last time we bought it. With historical sales forecasting, you start with past data and then make adjustments based on a number of factors, such as changes in price, the state of the industry or market, and the size of your sales team.
Historical sales forecasting example
To understand how a company might use historical forecasting, let’s say that your company made $2 million in sales revenues last year. If you truly expected nothing to change, you might forecast that you’ll also sell for $2 million this year. But in most cases, historical forecasting is a little more complex.
Perhaps we look at data from the last several years and find that, on average, sales have grown 10% each year. You could then use the historical growth data to adjust the historical sales data.
- Previous year’s sales = $2,000,000
- Average annual growth = 10%
- Sales forecast = $2,200,000
$2 million in sales with 10% expected growth leaves you with a forecast of $2.2 million. This is how historical forecasting can combine different metrics for a more accurate forecast.
The trouble is that there are many variables when it comes to sales. Perhaps your competitor just released a new product that's very popular. Or maybe your best sales representative has left the company. When forecasting sales with historical data, you have to decide which factors are important enough to consider in your calculations.
Pros
- Quick and easy to calculate
- Based on confirmed past data
Cons
- Doesn’t account for internal or external changes
- Not helpful for high-growth companies
3. Length of sales cycle forecasting
In a way, length of sales cycle forecasting also relies on historical data, namely the average length of a company’s sales cycle.
How it works
The length of the sales cycle is how long it takes, on average, for a new lead to reach closed-won status. If you got a new lead today, when would you expect that deal to close?
These timelines can vary widely, depending on the type of product you sell, the size of the prospective customer, the price point, and more. That’s why it’s so important to use your own sales cycle data.
With data from your customer relationship management platform, you calculate the average length of your sales cycle. Then you compare that average sales cycle length with how long each of your opportunities has been in the sales cycle.
Length of sales cycle forecasting example
The first step in this forecast is to calculate the average length of your sales cycle. If you want to keep it really simple, you could add up the length of each closed-won deal’s sales cycle and divide it by the number of deals.
The drawback of this method is that it doesn’t account for the deals you lose. Fortunately, there’s a simple equation to remedy this. You begin by adding up the sales cycle lengths of all your deals in a given time period, whether you won or lost. You then divide that sum by the number of deals you won in that period. This adjusts your sales cycle length to avoid overly optimistic forecasts. The example below shows how calculating the average sales cycle with your lost deals changes the results.

Using this equation, we arrive at a 45-day sales cycle. You would then look at each potential deal and ask if it will reach 45 days within the time period for which you are forecasting.
Pros
- Based on extensive data
- Forecasts based on your sales cycle
Cons
- Requires a deep understanding of your sales cycle
- Cycle length may differ across prospect personas
4. Opportunity stage forecasting
Opportunity stage forecasting uses the structure of your sales process to estimate the likelihood that you will win a deal in a given period of time. Unlike other methods, it accounts for the fact that prospects who have progressed very far in your sales process are more likely to become customers.
How it works
When using the opportunity stage method, you estimate the likelihood of a deal closing based on what stage in the sales process it is in. For example, you might determine that any prospect who has reached the final stage has a 90% chance of closing, while those in the product demo stage have a 40% chance of closing.
In order to calculate your sales forecast for a given time period (a month, a quarter, etc.), you apply that likelihood to each potential deal. You multiply that likelihood by the estimated deal size to project future sales revenues.
Opportunity stage forecasting example
Let’s say that your company splits the buying journey into five deal stages and assigns each a win probability.
- Lead stage = 5% win probability
- Qualified stage = 15% win probability
- Demo stage = 40% win probability
- Trial stage = 60% win probability
- Proposal stage = 90% win probability
You would then look at each deal and multiply its estimated value by the win probability of its opportunity stage.
For instance, you estimate that Prospect A could be a $20,000 deal. They are currently in the trial stage of the buying cycle, so there’s a 60% likelihood it will result in a signed contract.
$20,000 deal size x .6 win probability = $12,000 forecasted sales
You would repeat this process with each opportunity and add up the projected sales to calculate an overall sales forecast.

Pros
- Accounts for lead stage
- Considers all deals in the pipeline
Cons
- Doesn’t adjust for time spent in the lead stage
5. Lead value forecasting
Any sales professional knows that not all leads are the same. Lead value forecasting puts the differences between types of leads at the forefront of sales projections.
How it works
Like many of the other methods, this one pulls from your historical data to make predictions about how certain types of leads will turn out. For instance, you may know that prospects in a certain industry tend to have the largest deals. Or, perhaps, leads are more likely to convert into customers when they make first contact through your website.
Lead value forecasting typically combines the average deal size of a certain type of lead with the average conversion rate of its type. This gives you an average lead value for similar prospects.
Lead value forecasting example
For example, let’s say your customers typically fall into one of the three following verticals:
- Restaurants
- Hotels
- Entertainment
Using past data, you determine the average deal size for each, as well as the win probability. You multiply deal size by win probability to arrive at a lead value for each lead type.
To create a sales forecast, you would multiply the number of each lead type by its lead value.

Pros
- Data-driven without extreme complexity
- Draws from your historical sales trends
Cons
- Excludes other important factors, like opportunity stage
- Doesn’t account for outliers
6. Pipeline forecasting
Pipeline forecasting can be very accurate… if you have the right data and technology. Because it analyzes each and every deal based on several factors, it typically requires a sales forecasting tool.
How it works
Pipeline forecasting is designed to take advantage of everything you know about your sales pipeline and sales process. Each deal assigned to each sales rep is analyzed based on several factors of the company’s choosing.
For example, using data from your CRM, smart sales forecasting software can combine the potential deal size not only with the opportunity stage, but with factors like deal type, length of time in stages, and even the win rate of the representative working the deal.
With access to a large pool of data, the right forecasting software can provide especially accurate projections. But, if you’re not providing new data and keeping your data clean, the calculations become less reliable.
Pipeline forecasting example
Let’s say you configure your pipeline forecasting software to take into account the following factors:
- Potential deal size
- Opportunity stage
- Lead source
- Prospect’s industry
The tool would pull data surrounding each factor from your CRM and crunch the numbers to produce the forecasted sales for each deal and for the sales team as a whole. The calculations themselves can be extremely complex.
For example, if you begin with a potential deal size of $100,000, you might determine that the current opportunity stage indicates a 50% likelihood of becoming a customer. If the lead source, however, is a customer referral, that would likely increase the win probability. And maybe customers in the prospect’s industry are less likely to choose your product.
Your RevOps team would have to work with the forecasting software to decide how to weigh these factors in the calculations.
Pros
- Highly data-driven
- Accounts for factors beyond the opportunity stage
Cons
- Usually requires sales forecasting software
- Requires clean and regularly updated data
7. Multivariable forecasting
Much like pipeline forecasting, multivariable forecasting incorporates several data points to evaluate potential deals and predict future sales revenue. While pipeline forecasting focuses specifically on the sales pipeline, multivariable forecasting can include a wider range of internal and external factors.
How it works
With multivariable sales forecasting, you not only consider deal size, opportunity stage, and lead type. This method often incorporates market conditions like the economy, seasonality, and competitor actions to predict demand for your product. By combing through both internal and external data, multivariable forecasting provides a holistic view of your sales possibilities.
Multivariable forecasting example
This is another method that can get very complex very fast. That’s why it typically relies on analytics software to balance all the competing factors. A sales forecasting analyst might input current lead data from their CRM, historical revenue numbers, broad economic indicators, and other metrics.
If your company sells luxury cars, for example, you would naturally consider how many leads you have while forecasting. But you might then use demographic data to adjust your likelihood of closing the deal, as well as economic insights to predict if a recession will reduce demand for your product. And then there’s the fact that the automotive industry is seasonal.
Advanced analytics tools (and skilled analysts) weigh all these details against each other to produce a sales revenue forecast that reflects the state of the business, the industry, and the economy.
Pros
- Highly accurate and data-driven
- Includes external factors like seasonality
Cons
- Usually requires sophisticated analytics tools
- Requires clean and up-to-date data from several sources
More Articles
How To Choose A Sales Forecasting Method
Just as not all sales teams use the exact same methods to close deals, they also don’t all use the same forecasting methods. If that were the case, this would have been a much shorter list. The right forecasting method depends on your type of business, the maturity of the business, the data and tools you have access to, and other factors.
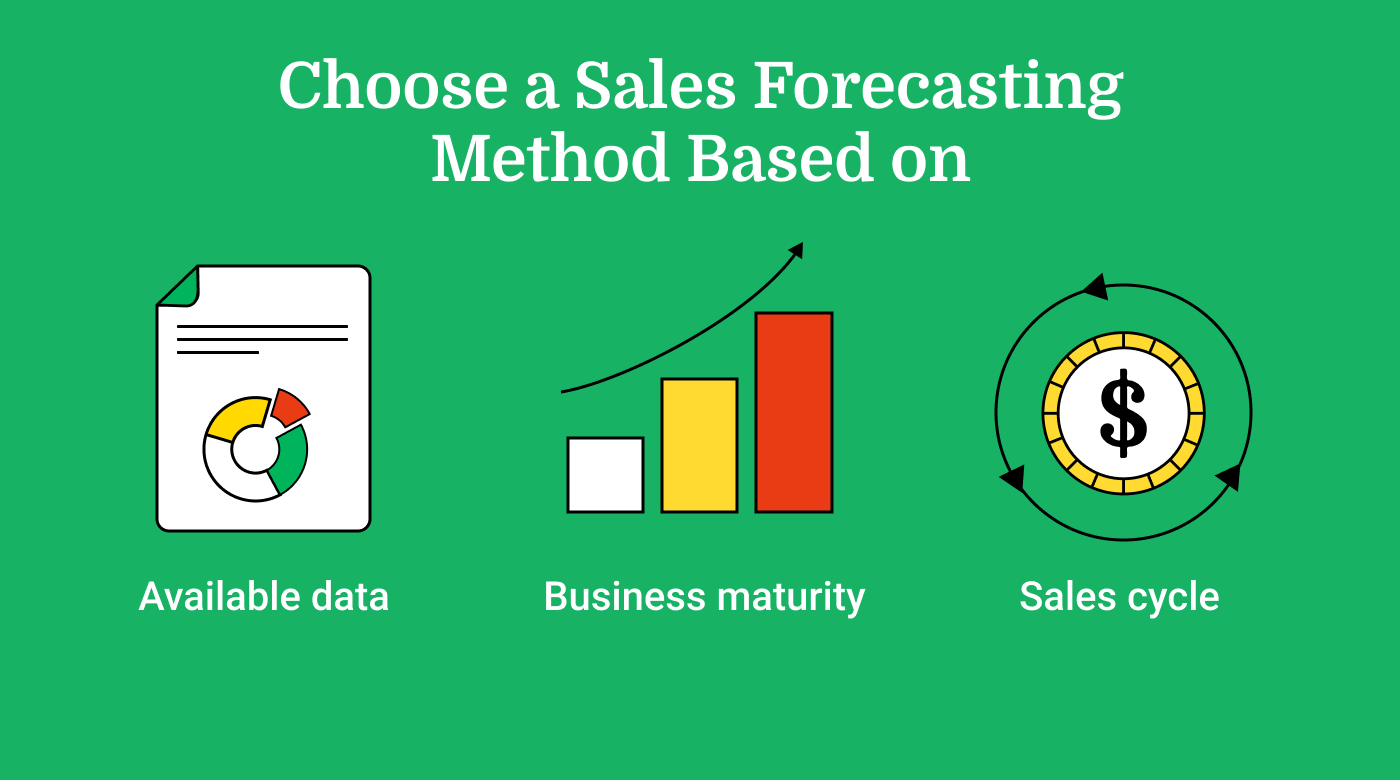
When you are choosing a sales forecasting method, some important questions to ask yourself are:
- Do I want to use a bottom-up or top-down forecasting method?
- Do I have the information I need to use a data-driven approach, or do I need to begin with more subjective methods?
- How mature and stable is my industry and my business? Are there annual or other long-term market cycles that impact sales?
- Do I have sales forecasting software or the resources to acquire it?
You may find that a forecasting method that worked for your business at one time is no longer the best choice. As tempting as it is to repeat what worked in the past, you should always ask yourself if the state of your business, industry, and data has changed and how that affects your sales forecasting methods.
Frequently Asked Questions
Still have questions? Here are some quick answers to common questions.
Which sales forecasting method is most used?
How do I make more accurate sales forecasts?
What is the quickest sales forecasting technique?
Do I need sales forecasting software?
Final Thoughts
No sales forecast will perfectly predict the future, but it can help your team set sales goals, allocate budget, and manage resources. And with so many different forecasting techniques, even new businesses or those with a complex sales cycle can create meaningful projections.
You can choose one of the examples above to model your forecasting, or you can combine different elements to create a custom formula.
To get weekly articles and insights from experts in revenue operations, subscribe to The RevOps Team newsletter.