20 Best Business Intelligence Platforms In 2024

10 Best Business Intelligence Platforms Shortlist
Here's my pick of the 10 best software from the 20 tools reviewed.


With so many different business intelligence platforms available, figuring out which is right for you is tough. You know you want to leverage your data assets for strategic advantages, operational improvements, and overall business growth but need to figure out which tool is best. I've got you! In this post I'll help make your choice easy, sharing my personal experiences using dozens of different business intelligence tools with various teams and data sets, with my picks of the best business intelligence platforms.
Why Trust Our Business Intelligence Platforms Reviews?
We’ve been testing and reviewing business intelligence platform since 2022. As revenue operation leaders ourselves, we know how critical and difficult it is to make the right decision when selecting software.
We invest in deep research to help our audience make better software purchasing decisions. We’ve tested more than 2,000 tools for different RevOps use cases and written over 1,000 comprehensive software reviews. Learn how we stay transparent & our business intelligence platform review methodology.
| Tools | Price | |
|---|---|---|
| Tableau | From $75/user/month | Website |
| TIBCO Spotfire | From $400/month for the Basic plan | Website |
| MicroStrategy | Pricing upon request | Website |
| Compass | From $7/user/month for a minimum of three users | Website |
| SAP BusinessObjects | Pricing upon request | Website |
| Pentaho | Pricing upon request | Website |
| Yellowfin BI | From $19/user/month | Website |
| SAS Business Intelligence | Pricing upon request | Website |
| QlikView | From $20/user/month with a 10 user minimum | Website |
| Oracle Business Intelligence | From $160.00/month for up to 10 users | Website |
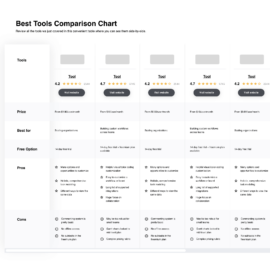
Compare Software Specs Side by Side
Use our comparison chart to review and evaluate software specs side-by-side.
Compare SoftwareHow To Choose Business Intelligence Platforms
With so many different business intelligence platforms available, it can be challenging to make decisions on what tool is going to be the best fit for your needs.
As you're shortlisting, trialing, and selecting business intelligence platform, consider the following:
- What problem are you trying to solve - Start by identifying the business intelligence platform feature gap you're trying to fill to clarify the features and functionality the tool needs to provide.
- Who will need to use it - To evaluate cost and requirements, consider who'll be using the software and how many licenses you'll need. You'll need to evaluate if it'll just be the revenue operation leaders or the whole organization that will require access. When that's clear, it's worth considering if you're prioritizing ease of use for all or speed for your business intelligence platform power users.
- What other tools it needs to work with - Clarify what tools you're replacing, what tools are staying, and the tools you'll need to integrate with, such as accounting, CRM, or HR software. You'll need to decide if the tools will need to integrate together or if you can replace multiple tools with one consolidated business intelligence platform.
- What outcomes are important - Consider the result that the software needs to deliver to be considered a success. Consider what capability you want to gain or what you want to improve, and how you will be measuring success. For example, an outcome could be the ability to get greater visibility into performance. You could compare business intelligence platform features until you’re blue in the face but if you aren’t thinking about the outcomes you want to drive, you could be wasting a lot of valuable time.
- How it would work within your organization - Consider the software selection alongside your workflows and delivery methodology. Evaluate what's working well and the areas that are causing issues that need to be addressed. Remember every business is different — don’t assume that because a tool is popular that it'll work in your organization.
Best Business Intelligence Platform Reviews
Are you ready to start exploring the top business intelligence tools on my list? Keep reading to discover platform summaries, standout features, pricing and free trial information, and a few pros and cons for each solution. I’ve also included some information on integrations to help you figure out whether a tool fits into your tech stack.

This BI platform is designed to encourage organizations to become more data-driven with a wide breadth and depth of capabilities that can serve the smallest businesses and the largest. Tableau strives to deliver a seamless end-to-end user experience with unmatched flexibility in automation and customization that can adapt to your environment.
Why I picked Tableau: I chose this tool because it offers a generative AI that simplifies data modeling and exploration to surface insights faster for every business user. Use the Einstein Copilot from Salesforce in Tableau to improve visibility and dashboard quality through prescriptive guidance and automation.
Tableau Standout Features and Integrations
Standout features include a data prep tool that cleans your data before analysis and cloud implementation that increases accessibility for everyone in your organization.
Integrations include Asana, ClickUp, Google Analytics 360, MATLAB, OptiSigns, Procore, Salesforce, Smartsheet, SurveyMonkey, and Yodeck.
Pros and cons
Pros:
- Can handle large data sets
- Allows for custom SQL
- Supports almost all connectors
Cons:
- Overall UI could be better
- The server can be a bit slow

An analytics platform that strives to transform your business data quickly and intuitively, TIBCO Spotfire offers convenient connections with a variety of databases, files, APIs, servers, and web services to facilitate deep data discovery. With 16 types of data visualizations, you can then interpret your data with map, bar, line, heat, and pie charts.
Why I picked TIBCO Spotfire: This platform made my roundup because it was specifically designed for data scientists and business analysts. Whether you use R or Python, you can empower yourself with seamless data science workflows and point-and-click functionalities that scale to fit your needs.
TIBCO Spotfire Standout Features and Integrations
Standout features include no-code, drag-and-drop functionality for non-technical users and affinity analysis that finds unique connections between various data points.
Integrations include Benchling, EZ-MES, GreaseBook, Grooper, JobScore, MATLAB, MongoDB, Productioneer, Smartsheet, Workable, and ZEMA.
Pros and cons
Pros:
- Truly beautiful data visualizations
- Cloud and web deployment
- Easy to use and learn
Cons:
- No universal pricing model
- No version for Mac OS

As a self-service business intelligence solution, MicroStrategy is designed to help you make data-driven decisions faster through a selection of data exploration and sharing tools. With access to intuitive visualizations, unlimited data sources, and mobile tools, every person in your organization can analyze data and report on relevant metrics.
Why I picked MicroStrategy: One unique thing about this platform is the way it allows you to query your data. You don’t have to deal with the complexity of SQL using MicroStrategy. Instead, this platform will automatically translate your questions into an SQL query through natural language processing.
MicroStrategy Standout Features and Integrations
Standout features include an AI chatbot that provides answers and summaries based on a single dashboard or report, as well as embedded analytics that you can integrate into any product.
Integrations include Amazon Redshift, Cloudera, databricks, Google, Microsoft SharePoint, Microsoft Word, MongoDB, Salesforce, Snowflake, and Vibe.
Pros and cons
Pros:
- Quick implementation and installation
- Intuitive user navigation
- Easy to learn the tools
Cons:
- Platform isn’t as responsive on smaller screens
- Cost is higher than other tools

As a developer experience platform, compass is designed to bring your collaborating teams and your distributed software architecture together in a single, unified space. Use this platform for data management with a component catalog, improve customer service with health tracking metrics, and reduce context switching by integrating all your data sources.
Why I picked Compass: I added this platform to my list because it serves developers with unique features that untangle architecture and prevent software sprawl. Get a comprehensive view of every component your team relies on and add new components easily with documentation that ensures you know who owns what.
Compass Standout Features and Integrations
Standout features include templates that automate consistency and accelerate production paths, and scorecards that help you codify best practices and processes at scale.
Integrations include AWS, Bamboo, BitBucket, Confluence, Crowd, GitHub, Jira, New Relic, TideLift, and Trello.
Pros and cons
Pros:
- Ideal for scaling organizations
- Simple to add integrations
- Easy to deploy and customize
Cons:
- Premium tools come at a premium price
- Design and navigation are a little outdated
Best for enterprise-grade self service to increase user autonomy
SAP BusinessObjects is a BI suite that offers reporting and visualization tools that help you gain insight into the key metrics that matter to your organization, including revenue, sales performance, and resource allocation. You can deploy in the cloud or on-premise to empower your team to access the data they need anytime, from anywhere.
Why I picked SAP BusinessObjects: This enterprise-grade reporting system caught my eye because of its dashboard-based user interface and prioritization of self-service tools. You can access ad hoc reporting, forecasting, and planning without technical experience and use conversational tools to share insights and synchronize workflows.
SAP BusinessObjects Standout Features and Integrations
Standout features include sharing tools that allow you to embed analytics into Microsoft PowerPoint and real time analytics through a connection with the SAP Business data warehouse.
Integrations include Google Analytics 360, Google Drive, HubSpot CRM, Meta for Business, Microsoft PowerPoint, Qualtrics CoreXM, QuickBooks, Salesforce Sales Cloud, Twitter, and Zoho Expense.
Pros and cons
Pros:
- Excel-based functionality is easy to use
- Robust training and online courses
- No need for technical data analysts
Cons:
- User interface is a little cumbersome
- Limited data transformation capabilities

As a data solution for enterprise-level organizations, Pentaho can support the data analytics needs of organizations in industries like retail, healthcare, and financial services by allowing them to access, combine, and manage data from a variety of sources. Use Pentaho to drill-drown into your data and find new revenue streams, minimize risk, and operate more efficiently.
Why I picked Pentaho: This tool from Hitachi stands out because it’s all about enterprise solutions. Using an expanded library of data connectors you can rapidly integrate and blend data from any source in the cloud or on-premise, as well as aligning data prep and modeling management that scales to any data pipeline workload.
Pentaho Standout Features and Integrations
Standout features include codeless software that makes it easier to prepare and analyze data, and dataflow orchestration that allows you to switch between Kettle and Spark engines.
Integrations include AlayaCare, AWS, Azure, Bitium, COMP4, Creatio CRM, DataKitchen, GCP, Studio Creatio, and VIENNA Advantage ERP & CRM.
Pros and cons
Pros:
- Hardware-compatible ETL system
- Nice-looking data visualizations
- Easy to set up and build reports
Cons:
- Small community of users
- Limited communication and collaboration tools

As an enterprise and embedded analytics platform, Yellowfin BI is designed to combine automated analysis, action-based dashboards, and storytelling to simplify actionable insights and provide next-step recommendations. This highly flexible and scalable solution is a web application that’s easy to embed seamlessly into your app.
Why I picked Yellowfin BI: One really cool feature from this platform is the Automated Business Monitoring. This tool from Yellowfin BI consistently monitors changes and outliers in your data in real time through threshold based alerts (or fully automated AI-driven signals) to ensure you’re notified the minute anything critical changes in your operations.
Yellowfin BI Standout Features and Integrations
Standout features include action-based dashboards with embedded operational workflows and automated storytelling through natural language processing.
Integrations include GitHub, Google Analytics 360, Google Sheets, Instagram, Meta for Business, Microsoft Dynamics 365, Salesforce, Tableau, Xero, and Zendesk Suite.
Pros and cons
Pros:
- Robust online forum for advice
- Intuitive user interface
- No-code options for non-technical users
Cons:
- Report performance could be improved
- Minimal improvements to core functionalities
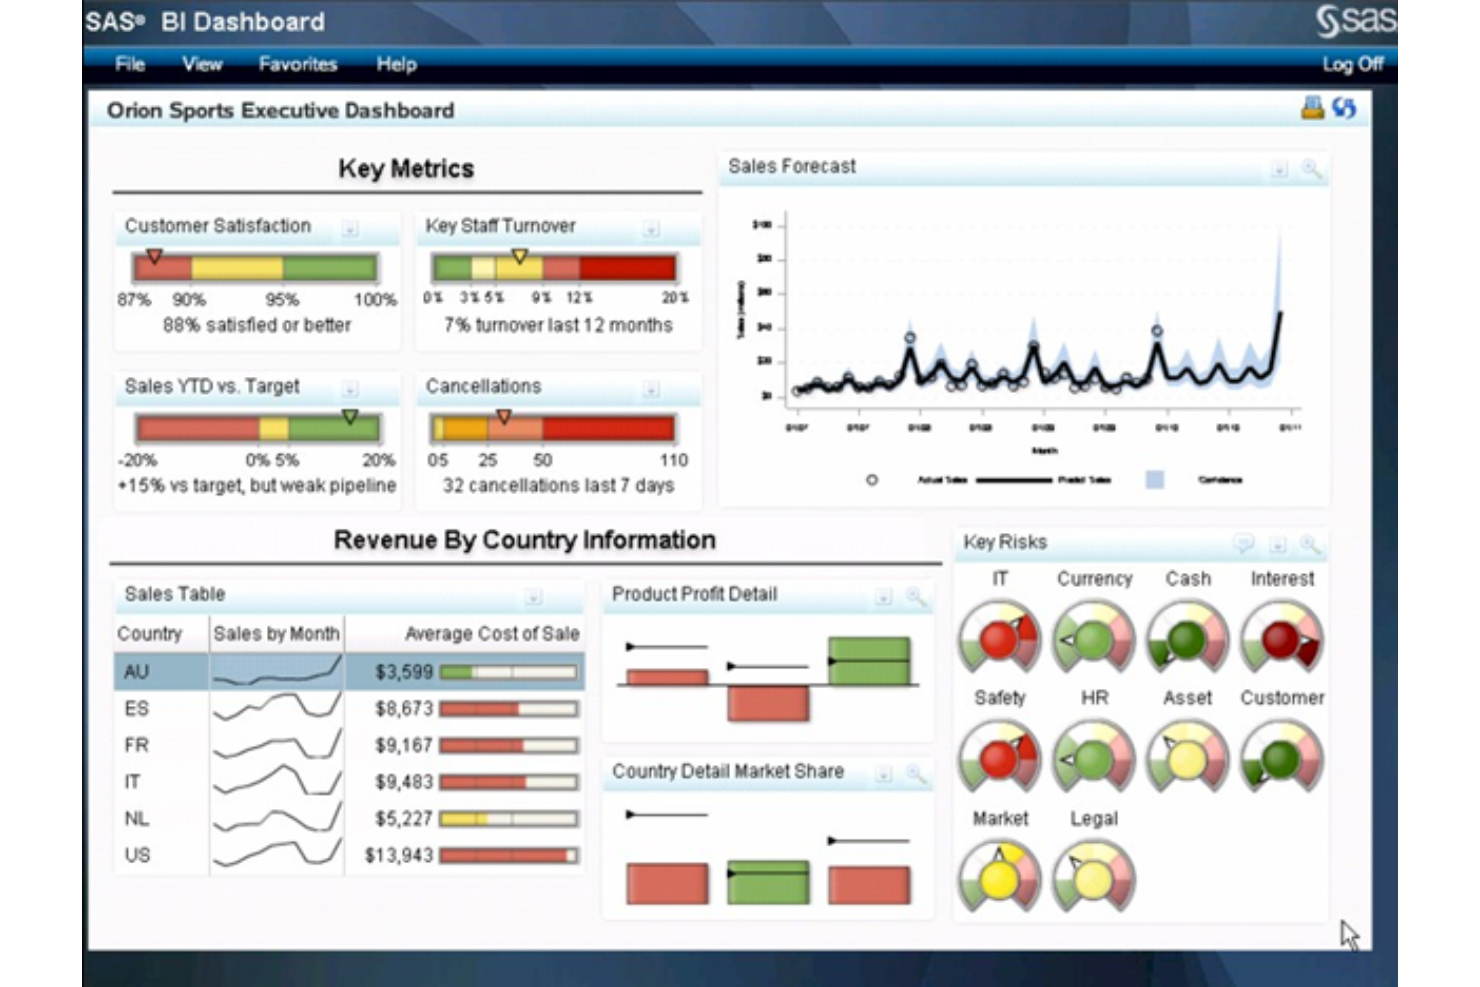
SAS Business Intelligence is a BI tool that delivers actionable insights through augmented analytics. With machine learning and artificial intelligence, this platform helps you access fast, automated insights for better decision-making that positively impacts your organization.
Why I picked SAS Business Intelligence: One thing I really liked about this platform was that it focused on sending you automated insights without you having to do anything. You simply set your most important metrics, and the SAS Business Intelligence AI platform will automatically run forecasting and modeling before sending you an alert that explains and contextualizes the results.
SAS Business Intelligence Standout Features and Integrations
Standout features include natural language generation that automatically provides easy-to-understand results and low-code analytics through a drag-and-drop editor.
Integrations include Adobe Audience Manager, Facebook, Google Analytics, Google Tag Manager, Salesforce CRM, Salesforce Marketing Cloud, Snowflake, Twilio, WeChat, and WhatsApp.
Pros and cons
Pros:
- No-code and low-code options
- Easy to use the tools
- Best for data mining
Cons:
- Report creation can be difficult
- User interface can feel boring

QlikView was the original data analytics revolutionary, and they’ve now release Qlik Sense to set a new benchmark for analytics with a full range of use cases that includes interactive dashboards, self-service analytics, customer behavior tracking, and embedded analytics. Use this tool with AI-powered suggestions to get the most out of your data.
Why I picked QlikView: The reason this platform stood out to me was because of Qlik Sense, an analytics tool that empowers anyone to get next-level insights out of their data. Using powerful AI, Qlik Sense can transform data into storytelling with NLP and automatically generate visualizations that are simple to read and understand.
QlikView Standout Features and Integrations
Standout features include data integration through open and standard APIs and no-code automation that interprets data for you.
Integrations include Amazon Aurora, Couchbase, Databricks, Firebird, Google Analytics, JSON, Mailchimp, MongoDB, OpenAI, Facebook Insights, LinkedIn, and Twitter.
Pros and cons
Pros:
- Supportive online community
- Has solutions for technical and non-technical users
- Ideal for mid-level organizations
Cons:
- Initial learning curve is steep
- High tier plans are expensive

The Oracle BI platform is a suite of applications and technology designed to offer you an integrated, end-to-end enterprise performance management system with a BI foundation and tools. You can use this solution to analyze and query data, set up alert and notification automation, and create reports with interactive visualizations.
Why I picked Oracle BI: This tool made my list because it offers the flexibility and scalability you need to achieve enterprise status. With the Oracle Business Intelligence Server, you gain access to the enterprise edition, which prioritizes optimizing concurrency and parallelism to ensure accessibility for the largest possible audience.
Oracle BI Standout Features and Integrations
Standout features include Oracle Business Intelligence Answers for end user ad hoc capabilities and Oracle Business Intelligence Publisher to get efficient reporting in the most complex environments.
Integrations include Accountagility ORYX, DataTerrain, Espresso, iOS14, Kodiak Hub, Microsoft Azure, Microsoft PowerPoint, Rayven, TSM, and VKS.
Pros and cons
Pros:
- Minimal training needed to get started
- User friendly interface and navigation
- Provides tutorials to guide you through the tools
Cons:
- Limited mobile capabilities
- Limited customization in reporting
Other Business Intelligence Platforms
I couldn’t complete this list of analytics platforms without mentioning a few more options. Check out these additional solutions to see if one of them fits your needs better than those on the main list.


Related Business Intelligence Platform Reviews
If you still haven't found what you're looking for here, check out these tools closely related to business intelligence platforms that we've tested and evaluated.
- Sales Software
- Lead Management Software
- Business Intelligence Software
- Contract Management Software
- Revenue Management System
- CPQ Software
Selection Criteria For Business Intelligence Platform
Selecting the ideal business intelligence platform involves a thorough assessment of its features, ensuring they align perfectly with specific business needs and revenue operations management. Drawing from my personal experiences and extensive research, I've developed a set of criteria to evaluate these platforms comprehensively.
Core Business Intelligence Platform Functionality: 25% of total weighting score
To be considered for inclusion on my list of the best business intelligence platform, the solution had to support the ability to fulfill common use cases:
- Streamlining data processing and integration
- Enhancing data visualization and reporting
- Providing scalable and secure data storage solutions
- Facilitating predictive and prescriptive analytics
- Supporting decision-making with real-time data access
Additional Standout Features: 25% of total weighting score
- Incorporation of AI and machine learning for advanced data analysis
- Exceptional customization options for dashboards and reports
- Superior integration capabilities with new market tools and platforms
- Cutting-edge security features ensuring data integrity
- Innovative collaboration features for team-based analytics
Usability: 10% of total weighting score
- Balance between advanced functionality and user-friendly interface
- Streamlined navigation and intuitive layout
- Accessibility across devices and platforms
Onboarding: 10% of total weighting score
- Comprehensive training materials like video tutorials and user guides
- Quick setup and deployment processes
- Interactive assistance such as chatbots and live support
Customer Support: 10% of total weighting score
- Availability of multiple support channels
- Responsiveness and effectiveness of the support team
- Proactive customer service and support
Value For Money: 10% of total weighting score
- Competitive pricing with clear delineation of feature tiers
- Flexibility in pricing plans to suit various business sizes
- Transparent cost-benefit analysis
Customer Reviews: 10% of total weighting score
- Positive feedback on functionality and ease of use
- Critiques on areas of improvement and how they are addressed
- Customer testimonials highlighting specific benefits
These criteria ensure that the selected business intelligence platform not only meets the fundamental requirements but also offers unique features that provide significant value to businesses, enhancing their ability to effectively manage and optimize revenue operations.
Trends In Business Intelligence Platforms For 2024
The rapid evolution of business intelligence platforms reflects a broader trend towards enhancing analytical capabilities and streamlining revenue operations in businesses of all sizes. Let's explore the most significant developments:
Core Trends and Evolutions
- Integration with Emerging Technologies: Platforms are increasingly integrating AI and machine learning to automate data analysis and provide deeper insights.
- Real-time Data Processing: There's a shift towards supporting real-time analytics to help businesses react more quickly to market changes.
Novel and Unusual Functionalities
- Predictive Analytics: The use of advanced predictive models to forecast trends and behaviors is becoming more common, providing businesses with a proactive tool to anticipate future challenges.
- Augmented Analytics: Tools are incorporating augmented reality to visualize data in new ways, making complex information more accessible and understandable.
Most Important and In-Demand Features
- Data Visualization Tools: These remain critically important, with enhancements that allow for more customizable and interactive dashboards.
- Collaborative Features: As remote work continues to dominate, BI platforms are enhancing features that support collaboration across teams and geographies.
Declining Features
- Static Reporting: The demand for static, traditional reports is diminishing in favor of dynamic, interactive reporting systems that offer users deeper insights.
These trends demonstrate a significant transformation in the business intelligence sector, driven by the need to adapt to a fast-paced, data-driven business environment. For revenue operation leaders, selecting a BI platform that aligns with these trends is crucial to maintaining competitive advantage.
What Are Business Intelligence Platforms?
Business intelligence platforms are technological solutions that facilitate comprehensive data analysis for businesses. These platforms integrate, process, and analyze data from various sources, presenting it in an accessible and actionable format through reports, dashboards, and visualizations. They serve as centralized systems for data-driven insights, catering to the diverse information needs within an organization, from operational metrics to strategic decision-making.
The benefits of business intelligence platforms include enabling informed decision-making through data-driven insights. They help in understanding market trends, customer behavior, and internal business processes, leading to improved strategic planning and operational efficiency. These platforms provide a competitive edge by offering a deeper analysis of business performance and market dynamics. Additionally, they support scalability, adapting to the growing and evolving data needs of a business, and facilitate risk management by identifying potential issues and opportunities.
Features Of Business Intelligence Platforms
Selecting a business intelligence platform to manage revenue operations requires understanding the key features that drive efficiency and insight. Here are the most critical features to look for:
- Real-Time Analytics: Provides immediate insights into business performance.
- Essential for making timely decisions that can significantly impact revenue growth.
- Data Visualization: Transforms complex data sets into understandable graphics.
- Crucial for communicating insights across the organization quickly and effectively.
- Predictive Analytics: Uses historical data to forecast future trends.
- Helps anticipate market changes and adjust strategies accordingly.
- Data Integration: Combines data from various sources into a cohesive platform.
- Vital for a holistic view of the business operations and customer interactions.
- Customizable Dashboards: Allows users to tailor interfaces to their specific needs.
- Enhances user engagement and productivity by focusing on key metrics.
- Collaboration Tools: Facilitates sharing insights and reports across teams.
- Supports a cohesive strategy and alignment across different departments.
- Scalability: Adapts to the growing amount of data and evolving business needs.
- Ensures the platform will continue to be useful as the business expands.
- User Access Management: Controls who can see and manipulate data.
- Important for maintaining data security and integrity.
- Mobile Accessibility: Provides access to data and insights on the go.
- Increases the flexibility and responsiveness of teams.
These features collectively ensure that a business intelligence platform can effectively support and enhance revenue operations by providing deep insights, fostering communication, and ensuring data-driven decision-making processes.
Benefits Of Business Intelligence Platforms
Business intelligence platforms provide essential tools for organizations looking to enhance their revenue operations management. Here are five key benefits:
- Enhanced Decision Making: Delivers actionable insights for informed decision-making.
- Facilitates strategic planning by providing accurate and up-to-date information.
- Increased Operational Efficiency: Automates data analysis processes.
- Reduces manual work and allows teams to focus on strategic tasks.
- Improved Data Quality and Accuracy: Centralizes data management.
- Helps maintain consistent and error-free data across the organization.
- Customizable Reporting: Offers tailored reports to meet specific business needs.
- Enables users to view data in formats that best suit their operational goals.
- Scalability: Adapts to growing data needs and business expansion.
- Supports business growth without the need for frequent software changes.
Costs & Pricing For Business Intelligence Platforms
Selecting the right business intelligence platform involves understanding different pricing plans tailored to meet various organizational needs and budgets. Here’s a breakdown of typical plan options available:
| Plan Type | Average Price | Common Features |
|---|---|---|
| Basic | $10 - $30 per user/month | Basic analytics, data visualization, limited dashboards |
| Professional | $50 - $100 per user/month | Advanced analytics, more integrations, custom reports |
| Enterprise | Custom pricing | Full feature access, advanced security, dedicated support |
| Free | $0 | Access to basic features, limited data capacity |
When choosing a plan, consider not just the cost but how the features align with your business size and needs. A plan that scales appropriately with your growth and provides essential analytical capabilities without overstretching your budget is ideal.
Business Intelligence Platform Frequently Asked Questions
There is plenty more to learn about business intelligence tools, so what other questions do you have? Here are some answers to the most common concerns to get you started.
Who uses business intelligence platforms?
Business intelligence tools are useful for nearly every industry, but adoption is quicker among some verticals, including healthcare, finance, and entertainment. Some departments in your organization which may benefit most from these platforms include:
- Sales: This team can gain new insights into market trends that ensure better sales strategies.
- Analysts: They can use this tool to better understand market trends and customer behavior.
- Marketing: They can use BI to analyze the effectiveness of campaigns for better optimization.
- IT Teams: Your technical teams can leverage BI to process large data sets and generate reports.
What are 5 systems for business intelligence?
There are many types of business intelligence, and BI software typically combines some or all of them into a single platform. Some of the most common tools you’ll see include:
- Spreadsheets: Widely used among those who prefer manual analytics, these include Google Sheets and Microsoft Excel.
- Data visualizations: From charts to graphs, visualizations are BI systems that make your data easier to read.
- Data mining tools: Finding and organizing large amounts of data isn’t simple, so these platforms leverage machine learning and artificial intelligence to make it work.
- Reporting software: This system reports, filters, organizes, and displays data in a way that allows you to surface insights faster.
- Online analytical processing: Also known as OLAP, you can use these tools to analyze datasets from various angles based on unique business perspectives.
Can business intelligence platforms predict market trends?
Yes, many business intelligence platforms are equipped with predictive analytics capabilities that analyze historical data and current market conditions to forecast future trends. These tools utilize algorithms and machine learning to provide insights that can help companies anticipate market movements and adjust their strategies accordingly.
What customer support options are offered in business intelligence platforms?
Business intelligence platforms typically offer a range of customer support options including online support portals, live chat, email, and phone support. Some vendors also provide dedicated account managers and 24/7 support for critical issues, ensuring that businesses can get help whenever needed.
How do business intelligence platforms manage large data sets?
Business intelligence platforms are designed to handle large data sets efficiently. They use technologies such as data warehousing, in-memory processing, and data compression to improve data retrieval and performance. Advanced platforms also offer data governance tools to help ensure data quality and consistency across large datasets.
Additional RevOps Software
There are tons of other tools you may need to round out your tech stack. Check out my overviews of all these other solutions to find the right blend for your business needs:
- Cloud BI Tools
- Sales Analytics Software
- Revenue Intelligence Platforms
- Sales Intelligence Software
- Predictive Analytics Software
- Business Development Software
- Sales Forecasting Software
Conclusion
You may feel overwhelmed with all the information I just dropped on you, but it should be simple to narrow down your top few preferences from my list. Sign up for the free trials and demos to see how these tools actually perform and narrow your choices down even further. I’m confident you’ll be able to find the right tool for your needs.
And if you want to stay updated on the newest trends in the revops world, sign up for the newsletter to get weekly insights from the experts!