24 Best OLAP Tools Reviewed For 2024

10 Best OLAP Tools Shortlist
Here's my pick of the 10 best software from the 24 tools reviewed.


With so many different OLAP tools available, figuring out which is right for you is tough. You know you want to query large amounts of data in a flexible and efficient manner but need to figure out which tool is best. I've got you! In this post I'll help make your choice easy, sharing my personal experiences using dozens of different OLAP software with various teams and databases, with my picks of the best OLAP tools.
Why Trust Our OLAP Tool Reviews?
We’ve been testing and reviewing OLAP tools since 2022. As revenue operation leaders ourselves, we know how critical and difficult it is to make the right decision when selecting software.
We invest in deep research to help our audience make better software purchasing decisions. We’ve tested more than 2,000 tools for different RevOps use cases and written over 1,000 comprehensive software reviews. Learn how we stay transparent & our OLAP tool review methodology.
| Tools | Price | |
|---|---|---|
| Toucan | Pricing upon request | Website |
| Tableau | From $75/user/month | Website |
| Adverity | From $548/month | Website |
| Domo | Pricing upon request | Website |
| Sisense | Pricing upon request | Website |
| Grow | From $1,500/month | Website |
| Reveal | No price details | Website |
| Minitab | From $1780/year | Website |
| Sisense | Pricing available upon request | Website |
| icCube | From $24,000/year | Website |
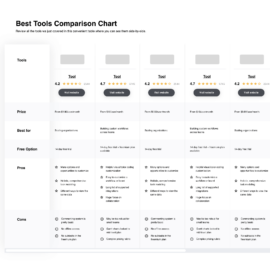
Compare Software Specs Side by Side
Use our comparison chart to review and evaluate software specs side-by-side.
Compare SoftwareHow To Choose OLAP Tools
With so many different OLAP tools solutions available, it can be challenging to make decisions on what tool is going to be the best fit for your needs.
As you're shortlisting, trialing, and selecting OLAP tools, consider the following:
- What problem are you trying to solve - Start by identifying the OLAP tool feature gap you're trying to fill to clarify the features and functionality the tool needs to provide.
- Who will need to use it - To evaluate cost and requirements, consider who'll be using the software and how many licenses you'll need. You'll need to evaluate if it'll just be the revenue operation leaders or the whole organization that will require access. When that's clear, it's worth considering if you're prioritizing ease of use for all or speed for your OLAP tool power users.
- What other tools it needs to work with - Clarify what tools you're replacing, what tools are staying, and the tools you'll need to integrate with, such as accounting, CRM, or HR software. You'll need to decide if the tools will need to integrate together or if you can replace multiple tools with one consolidated OLAP tool.
- What outcomes are important - Consider the result that the software needs to deliver to be considered a success. Consider what capability you want to gain or what you want to improve, and how you will be measuring success. For example, an outcome could be the ability to get greater visibility into performance. You could compare OLAP tool features until you’re blue in the face but if you aren’t thinking about the outcomes you want to drive, you could be wasting a lot of valuable time.
- How it would work within your organization - Consider the software selection alongside your workflows and delivery methodology. Evaluate what's working well and the areas that are causing issues that need to be addressed. Remember every business is different — don’t assume that because a tool is popular that it'll work in your organization.
Best OLAP Tool Reviews
Let’s take a dive into my overview of each OLAP tool to get a snapshot of their inner workings, and an exploration of their standout features, essential integrations, and a few pros and cons that may help you narrow down the best choice.

Instead of revealing data about your internal operations, Toucan is designed as a customer-facing analytics platform to ensure you’re providing the best end-user experience. Toucan provides guided data visualization and an app gallery you can use as a starting point for dashboard customization.
Why I picked Toucan: The thing that I found really cool about this platform was its focus on making data more interesting. With the Storytelling Framework and Guided Design features, you can create professional, engaging reports without needing to code or design.
Toucan Standout Features and Integrations
Standout features include Zero-Click Mobility that allows you to create an application once for access on any device and live data connections with any API-ready cloud data source.
Integrations include Aircall, Amazon Web Services, Azure, Microsoft SQL Server, MicroStrategy, MongoDB, Onedrive, SAP HANA, Snowflake, and Soap.
Pros and cons
Pros:
- Customer support is friendly and knowledgeable
- It supports many reporting visualization styles
- Versatile software can integrate with any workflow
Cons:
- High learning curve that requires customer support
- Can be daunting to learn initially
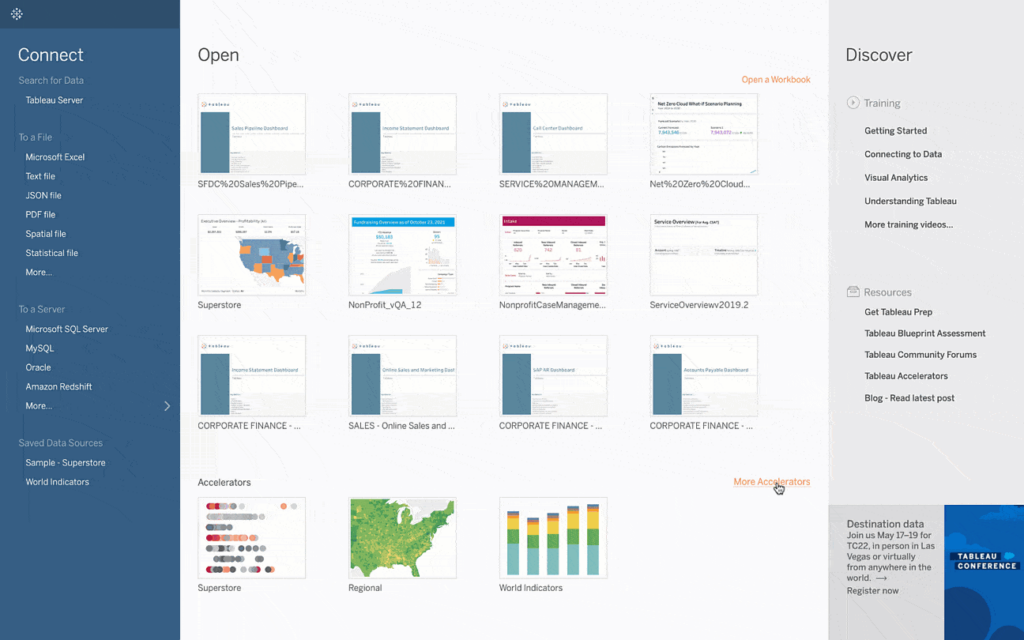
Designed to provide you more depth and serve the needs of the largest global enterprises, Tableau can fit in with any data strategy and workflow. Instead of dictating your performance management, it adapts to your environment with more flexibility in no-code queries, interactive data stories, and metadata management.
Why I picked Tableau: I like this OLAP system because it gives you more control over metadata management. With Tableau, you can modify number formats, create data subsets with selected groups of points, combine fields into groups, rename fields, and build new hierarchies.
Tableau Standout Features and Integrations
Standout features include cloud or self-hosted server options, enhanced security with Customer-Managed Encryption Keys (CMEK), and a content migration tool to define and schedule migration plans.
Integrations include Asana, ClickUp, Google Analytics, MATLAB, OptiSigns, Procore, Salesforce Sales Cloud, Smartsheet, SurveyMonkey, and Yodeck.
Pros and cons
Pros:
- No-code functionality, like drag-and-drop
- A lot of customization options
- Intuitive and easy to use
Cons:
- Lags when interfacing with Big Data
- Some data syncing issues

As an integrated data platform for marketing teams, Adverity specializes in empowering marketers with automated data integration from hundreds of sources, as well as providing a single source of knowledge that reveals the tangible impact of all marketing activities on your business.
Why I picked Adverity: This platform made my list because it was designed for non-technical users, like your marketing team. You can set up automations that enhance and unify your data with no coding required through easy-to-use script templates that automatically transform your data.
Adverity Standout Features and Integrations
Standout features include a data dictionary that’s auto populated to manage metrics and data mapping, as well as built-in data governance to ensure data quality and completeness.
Integrations include Box, Google Ads, Google Analytics, HubSpot Marketing Hub, Instagram, Mailchimp, Microsoft SharePoint, SEMrush, Shopify, and Twitter. The platform offers pre-built API connectors along with customizable universal connectors.
Pros and cons
Pros:
- Frequent updates and improvements
- Hundreds of integration options
- Easy to use once training is complete
Cons:
- Add-on tools can cost extra
- Some limitations on automations

Domo offers end users a cloud-native data platform that’s designed to go beyond traditional business intelligence analysis with user-friendly dashboards, actionable insights, and data visualizations that anyone can understand. Domo can connect with existing legacy and cloud systems.
Why I picked Domo: This platform made my list because it can incorporate ML and AI into your workflows. With these technologies, you can infuse your existing data with additional insights and ask questions in natural language queries for live analysis that helps you keep up with trends.
Domo Standout Features and Integrations
Standout features include ModelOps to reduce manual work and streamline deployment, as well as business-facing dashboards to share business data with non-technical users.
Integrations include Basecamp, DocuSign, DropBox Business, GitHub, Google Drive, Jira, Mailchimp, Microsoft Excel, SurveyMonkey, and Trello.
Pros and cons
Pros:
- Android and iOS native apps available
- Over 1,000 pre-built data connectors
- Drag-and-drop ETL capabilities
Cons:
- Customer service reps are mainly non-technical
- No navigation across related objects to retrieve fields in different data sets

As a data and analytics platform, Sisense strives to make it easier for your team to mashup data from across your entire landscape and transform it into actionable analytics that you can embed anywhere, including reports, web pages, and presentations. Sisense offers functionality in the cloud or on-premise, as well as a mix of both to provide more versatility.
Why I picked Sisense: I chose this platform for my list because they have a Notebook feature that allows you to leverage a combination of cached or live data models for optimal performance and resource management. Whether you do ad hoc analysis or build something more advanced, you can prep, cleanse, and perform sophisticated data transformations through SQL queries, R-code, and Python.
Sisense Standout Features and Integrations
Standout features include Git-based workflows to visualize and augment business analytics and scalable data processing for all skill levels, including no code, low code, and full-code.
Integrations include Dropbox Business, Gmail, Google Drive, Microsoft Excel, PayPal, QuickBooks Desktop Enterprise, Mailchimp, Salesforce Sales Cloud, Slack, and SurveyMonkey.
Pros and cons
Pros:
- Attractive user-interface design
- Highly customizable dashboards and reporting
- Very integratable with common databases
Cons:
- Installation is long and complex
- Customization can be tedious
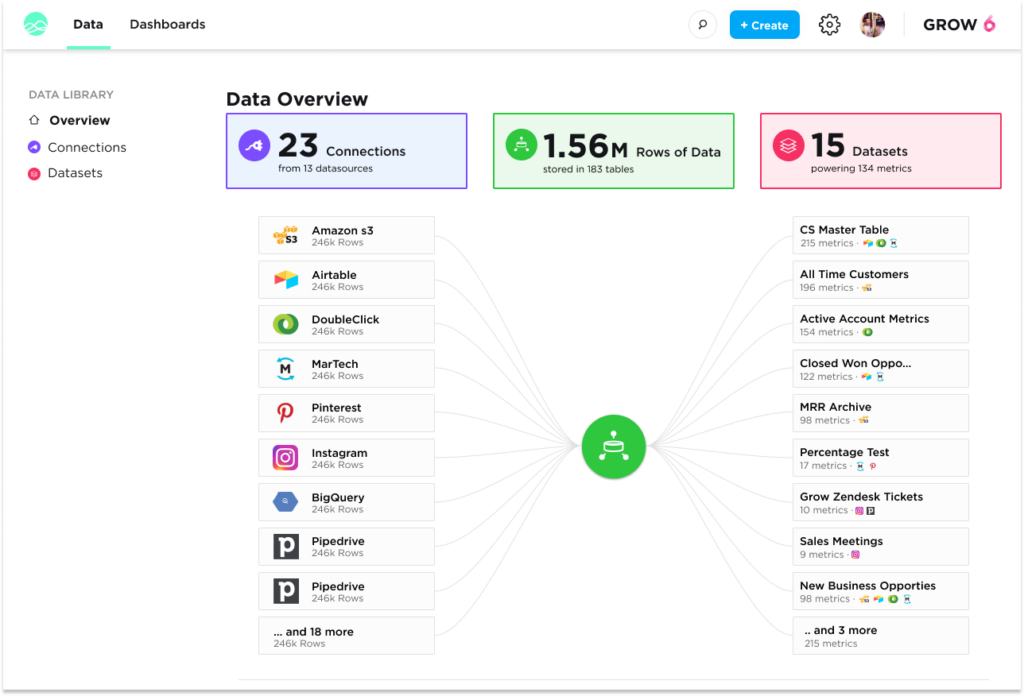
This no-code BI platform is meant to empower your entire organization to explore data for better decision-making for every team. Grow combines data warehousing, ETL, and visualizations with an OLAP server to help you connect and explore data and surface new insights.
Why I picked Grow: This platform has a few unique features, including automated reporting that keeps your data pipelines fresh with sync schedules that refresh your dashboards and other reports as the information changes. Customize your KPIs and metrics to see the things you truly care about.
Grow Standout Features and Integrations
Standout features include an OLAP database where you can access reusable data tables from multiple data sources and permissions-based control to authorize and assign raw stored tables.
Integrations include Dropbox, Facebook Ads, Google Ads, Google Analytics, Google Sheets, HubSpot, Instagram Business, MySQL, PostgreSQL, and Stripe.
Pros and cons
Pros:
- Knowledgeable customer support team
- Dashboards are easy to read
- Unlimited user license pricing model for better budgeting
Cons:
- Limited export capabilities
- Doesn’t offer all BI capabilities
Reveal
Best for providing pre-trained AI models developed by a team of data scientists

As a web-based eDiscovery software, Reveal can help your organization find, sort, and store electronic data to gain actionable insights from unstructured or structured datasets with a focus on AI and machine learning technology. This platform focuses on streamlining litigation, configuring workflows, and managing investment processes.
Why I picked Reveal: One standout feature from this platform is the pre-generated AI models that are designed by the in-house data scientist team. You can access out-of-the-box solutions, including data cleanup, toxic work environment detection, privileged document detection, and sexual harassment detection.
Reveal Standout Features and Integrations
Standout features include large language models for predictive content generation and legal hold management for discrete data preservation.
Integrations include NexLP.
Pros and cons
Pros:
- Lots of built-in features
- Intuitive navigation and interface
- Can be used in a cloud environment
Cons:
- Can’t print directly from the platform
- Pre-defined reports could be better

Minitab is a statistical software that integrates with a variety of open-source languages, as well as boosting your capabilities with machine learning algorithms, including TreeNet, Random Forests, and CART. You can also visualize your data in the Graph Builder, exploring any number of graph and chart configurations without re-running your analysis.
Why I picked Minitab: I put this platform on my list because it prioritizes better outcomes for products and processes through key statistical tests. With Minitab, you can run one and two proportions, t tests, chi-square, normality tests, and equivalence tests through their integrated approach.
Minitab Standout Features and Integrations
Standout features include measurement system analysis with gage studies and attribute agreement analysis, variable, time weighted control charts, and design of experiments with screen designs, full factorial, and fractional factoria.
Integrations include Amazon Aurora, Amazon Redshift, Box, CircleBack, Constant Contact, JMP, Microsoft PowerPoint, Microsoft Word, SIMUL8, and WinSPC.
Pros and cons
Pros:
- Large and knowledgeable support community
- Easy to use and navigate
- Very feature-rich platform
Cons:
- Interface feels a little bit outdated
- No visual or low-code options

As a data and analytics platform, Sisense strives to make it easier for your team to mashup data from across your entire landscape and transform it into actionable analytics that you can embed anywhere, including reports, web pages, and presentations. Sisense offers functionality in the cloud or on-premise, as well as a mix of both to provide more versatility.
Why I picked Sisense: I chose this platform for my list because they have a Notebook feature that allows you to leverage a combination of cached or live data models for optimal performance and resource management. Whether you do ad hoc analysis or build something more advanced, you can prep, cleanse, and perform sophisticated data transformations through SQL queries, R-code, and Python.
Sisense Standout Features and Integrations
Standout features include Git-based workflows to visualize and augment business analytics and scalable data processing for all skill levels, including no code, low code, and full-code.
Integrations include Dropbox Business, Gmail, Google Drive, Microsoft Excel, PayPal, QuickBooks Desktop Enterprise, Mailchimp, Salesforce Sales Cloud, Slack, and SurveyMonkey.
Pros and cons
Pros:
- Attractive user-interface design
- Highly customizable dashboards and reporting
- Very integratable with common databases
Cons:
- Installation is long and complex
- Customization can be tedious

As a B2B SaaS solution, icCube is designed to deeply embed analytic capabilities inside your applications through white-labeled dashboards, multidimensional OLAP analytics, and fine-grained security features. icCube is built to shorten your time to market and continually respond to changing market expectations and customer demands.
Why I picked icCube: This platform made my list due to its robust architecture. This platform offers a single Java process that runs on any OS as a result of modular architecture and respect for well-accepted language standards, including J2EE, HTTP, and JCR. You can set it up as a high availability solution with great reliability or as a redundant solution to maintain consistency.
icCube Standout Features and Integrations
Standout features include a self service dashboard editor with real-time data in a browser-based solution and branded design across all reports using the out-of-the-box wizard or Javascript.
Integrations include GitHub, Java data sources, Microsoft Excel, OLAP4J, Python data sources, and XMLA. Available REST API.
Pros and cons
Pros:
- Designed for quick embedding into other tools
- Has a lot of flexibility
- Very easy to use the platform
Cons:
- Restricted extensibility and expansion
- High pricing compared to competitors
Other OLAP Tools
My list of the top OLAP tools doesn’t have every single option out there, so here are a few more that might be the right fit for your organization:


Related OLAP Tool Reviews
If you still haven't found what you're looking for here, check out these tools closely related to OLAP tools that we've tested and evaluated.
- Sales Software
- Lead Management Software
- Business Intelligence Software
- Contract Management Software
- Revenue Management System
- CPQ Software
Selection Criteria For OLAP Tools
Selecting the right OLAP (Online Analytical Processing) tool is essential for organizations looking to enhance their data analysis capabilities and make informed decisions based on multi-dimensional data insights. My evaluation process is grounded in extensive research and firsthand testing, ensuring that the chosen OLAP tool aligns with the specific requirements of revenue operations management and offers robust functionality to address various analytical needs.
Core OLAP Tools Functionality: 25% of total weighting score
To be considered for inclusion on my list of the best OLAP tools, the solution had to support the ability to fulfill common use cases:
- Rapid processing of large data sets for timely decision-making.
- Deep analytical capabilities to uncover insights across various data dimensions.
- Support for predictive analytics and trend forecasting to anticipate future scenarios.
- Scalability to handle growing data volumes and user queries efficiently.
- Integration with various data sources and business intelligence platforms to ensure data consistency and accessibility.
Additional Standout Features: 25% of total weighting score
To distinguish exceptional tools, I consider:
- Advanced visualization capabilities that allow users to interpret complex data sets easily.
- Collaboration features that enable teams to share insights and make collective decisions.
- Mobile accessibility, ensuring that users can access analytical tools and data on the go.
- Customization options that allow businesses to tailor the tool to their specific analytical needs.
- Enhanced security measures to protect sensitive data and comply with industry regulations.
Usability: 10% of total weighting score
User experience is critical:
- Intuitive interfaces that facilitate quick adoption and minimize training requirements.
- Flexible reporting options that cater to various user preferences and analytical needs.
- Responsive design that ensures effective use across different devices and platforms.
Onboarding: 10% of total weighting score
Smooth onboarding is key to maximizing value:
- Access to educational resources like tutorials, documentation, and webinars to accelerate learning.
- Interactive guides or product tours that help new users navigate the software effectively.
- Support channels that provide timely assistance during the onboarding phase.
Customer Support: 10% of total weighting score
Reliable support enhances user satisfaction:
- Availability of comprehensive support, including live chat, email, and phone assistance.
- Proactive customer service that addresses issues and provides regular software updates.
- Community forums or user groups that foster peer-to-peer assistance and knowledge sharing.
Value For Money: 10% of total weighting score
Cost-effectiveness is crucial:
- Transparent pricing that reflects the software's value and feature set.
- Flexible pricing plans that accommodate the needs of different organization sizes and budgets.
- Demonstrable ROI, with features that contribute to meaningful insights and business outcomes.
Customer Reviews: 10% of total weighting score
Peer feedback offers valuable insights:
- Analysis of user reviews to gauge satisfaction and identify common praise or grievances.
- Consideration of how the software has evolved in response to customer feedback.
- Independent evaluations that benchmark the tool against industry standards and competitors.
By adhering to these criteria, I aim to guide software buyers toward selecting an OLAP tool that not only meets their immediate analytical needs but also supports their long-term business goals and revenue operations strategy. The right OLAP tool should empower organizations with deep insights, fostering informed decision-making and strategic growth.
Trends In OLAP Tools For 2024
OLAP tools are essential for dissecting large volumes of data, enabling organizations to derive actionable insights and make informed decisions swiftly. The latest trends in OLAP tools underscore a shift towards more advanced analytics, user-friendly interfaces, and integration capabilities, aligning with the dynamic needs of revenue operations management.
Integration with Advanced Analytics and AI:
- OLAP tools are increasingly incorporating AI and machine learning algorithms to enhance data analysis, offering predictive insights and automated anomaly detection.
- The integration of AI facilitates more sophisticated data modeling and forecasting, enabling users to anticipate market trends and make proactive decisions.
Enhanced Data Visualization and Interactive Reporting:
- There is a notable shift towards more intuitive data visualization capabilities, allowing users to comprehend complex information quickly and share insights across the organization.
- Interactive reporting features are evolving to enable users to drill down into specifics, customize views, and dynamically explore data from multiple angles.
Increased Emphasis on Collaboration Features:
- Collaboration tools are being integrated into OLAP platforms, enabling teams to work together on data analysis, share insights, and streamline decision-making processes.
- These features address the need for agile, cross-functional collaboration in fast-paced business environments, ensuring that key insights are effectively communicated and acted upon.
Scalability and Cloud Integration:
- OLAP tools are offering enhanced scalability options to manage vast data sets and user bases without compromising performance.
- Cloud-based OLAP solutions are becoming more prevalent, providing flexibility, reducing infrastructure costs, and facilitating remote access to data and analytical tools.
Declining Features:
- Traditional, static reporting is diminishing in favor of dynamic, real-time analysis capabilities.
- Isolated OLAP systems that lack integration with broader business intelligence and data ecosystems are losing favor, as businesses seek more interconnected analytical solutions.
These trends reflect the overarching needs and challenges faced by revenue operation leaders, emphasizing the demand for OLAP tools that provide deeper insights, foster collaboration, and adapt to the changing data landscape. As organizations strive to harness the full potential of their data for revenue optimization, the role of advanced OLAP tools becomes increasingly central, offering a blend of powerful analytics, user-centric design, and operational efficiency.
What Are OLAP Tools?
OLAP tools are software applications used for complex data analysis in business intelligence. They enable the examination and manipulation of data from multiple perspectives, supporting multidimensional queries and analysis. These tools aggregate, summarize, and analyze large volumes of data, allowing for in-depth exploration of business metrics and trends.
The benefits of OLAP tools include enhanced capability for detailed and comprehensive data analysis, leading to more informed decision-making in businesses. They allow users to quickly access, manipulate, and analyze large data sets, uncovering insights and trends that are critical for strategic planning. OLAP tools facilitate efficient data exploration and reporting, making them valuable for organizations seeking to improve their business intelligence and data-driven strategies. Their ability to handle complex data queries and provide rapid responses makes them essential for in-depth business analysis and reporting.
Features Of OLAP Tools
OLAP tools must offer a blend of robust analytics, user-friendly interfaces, and integration capabilities to address the multifaceted challenges of revenue operations. Here are the key features to consider when choosing an OLAP tool:
- Multidimensional Analysis: Allows users to examine data from various perspectives and dimensions.
- This feature is fundamental for dissecting complex data structures, enabling deeper insights into revenue-generating activities and customer behaviors.
- Advanced Analytics Capabilities: Provides sophisticated analytical functions, including predictive analytics and what-if scenarios.
- Understanding future trends and potential outcomes helps organizations strategize and make informed decisions to optimize revenue.
- High Performance and Scalability: Ensures the tool can handle large data volumes and complex queries efficiently.
- Quick response times and the ability to scale are essential for maintaining productivity and accommodating growth.
- Intuitive Data Visualization: Transforms data into easily interpretable visual formats.
- Visual representations of data help stakeholders comprehend complex information quickly, facilitating faster decision-making.
- Seamless Integration: Connects effortlessly with various data sources and business intelligence platforms.
- Integrating diverse data sources provides a holistic view of the organization's operations, crucial for effective revenue management.
- Collaboration Tools: Enables multiple users to work together, share insights, and make collective decisions.
- Collaboration features ensure that teams can work efficiently, align on strategies, and implement decisions that drive revenue growth.
- Customization and Flexibility: Allows users to tailor the system to their specific needs and preferences.
- Adaptable tools cater to unique business requirements, enhancing user satisfaction and overall effectiveness.
- Mobile Access: Provides the ability to access and analyze data from mobile devices.
- Mobile access is increasingly important for dynamic business environments, enabling decision-makers to stay informed and responsive while on the go.
- Data Security: Ensures data is protected through robust security measures.
- Protecting sensitive information is paramount, especially when dealing with financial and operational data critical to revenue management.
- Comprehensive Support and Training: Offers thorough user support and educational resources.
- Adequate support and training are vital for maximizing the utility of the OLAP tool, ensuring users can leverage its full capabilities effectively.
The right OLAP tool should empower organizations to navigate their data landscape with precision, offering actionable insights that drive revenue operations efficiently. By focusing on these essential features, businesses can choose a solution that not only meets their current analytical needs but also supports their ongoing growth and success.
Benefits Of OLAP Tools
OLAP tools are designed to help users extract significant value from their data, making complex information accessible and actionable. Here are five primary benefits that OLAP tools offer to users and organizations:
- Enhanced Data Insight: Delivers in-depth analysis of business data from multiple dimensions.
- By enabling multidimensional analysis, OLAP tools allow users to uncover hidden patterns, trends, and insights, facilitating strategic decisions that drive business growth.
- Improved Decision Making: Provides the analytical foundation for informed decision-making.
- Access to detailed, accurate, and timely data helps stakeholders make well-informed choices, reducing guesswork and enhancing the quality of business decisions.
- Increased Productivity: Automates data aggregation and analysis processes.
- By streamlining complex data operations, OLAP tools save time and effort, allowing teams to focus on analysis rather than data preparation, thus increasing overall productivity.
- Scalability and Flexibility: Adapts to growing data needs and changing business environments.
- OLAP tools are designed to scale with an organization's growth, accommodating increasing data volumes and complexity without sacrificing performance or user experience.
- Collaborative Analysis: Facilitates shared insights and collaborative decision-making.
- With features that support collaboration, OLAP tools enable teams to work together on data analysis projects, share insights, and reach consensus more effectively, thereby enhancing organizational alignment and execution.
Costs & Pricing For OLAP Tools
When selecting an OLAP tool, understanding the different pricing and plan options available is essential to ensure the chosen solution meets your organization's needs without exceeding its budget. OLAP tools vary significantly in complexity and capability, catering to a range of business sizes and requirements. Below is a detailed overview of common plan types you may encounter, providing insights into what each offers and at what cost:
Plan Comparison Table For OLAP Tools
| Plan Type | Average Price Range | Common Features Included |
|---|---|---|
| Basic | Free to $50 per user/month | Access to standard OLAP functionalities, basic data integration, simple visualizations, community support |
| Professional | $50 to $150 per user/month | Enhanced data analysis features, advanced visualizations, increased data capacity, technical support |
| Enterprise | $150 to $500 per user/month | Full feature access, scalability, extensive data integration options, premium support, advanced security features |
| Free Option | $0 | Limited functionalities, data capacity, and user access, basic support |
When choosing a plan, consider not only the current size and needs of your organization but also its potential growth. Opt for a plan that offers the flexibility to scale and adapt as your business evolves and your data analysis requirements become more sophisticated. Remember, the best choice will provide the capabilities you need at a price point that reflects the value to your organization.
OLAP Tool Frequently Asked Questions
Still need more information to get the full picture on OLAP tools? Check out the answers to some of the most frequently asked questions here.
Why should I use OLAP tools?
Using OLAP tools can significantly enhance your organization’s ability to analyze data efficiently and make informed decisions. Here are key reasons to incorporate OLAP tools into your business intelligence strategy:
- Multi-Dimensional Analysis: OLAP tools allow you to view data from multiple perspectives and dimensions, enabling a deeper understanding of complex information. This capability helps uncover hidden patterns, trends, and insights that can drive strategic business decisions.
- Improved Data Access and Speed: With OLAP tools, users can quickly access, manipulate, and analyze large volumes of data from various sources. The speed and efficiency of OLAP tools in processing complex queries mean faster insights and more timely decision-making.
- Enhanced Decision-Making: By providing comprehensive and detailed analyses, OLAP tools empower managers and decision-makers with the information they need to identify opportunities, address challenges, and drive business growth.
- Better Forecasting and Planning: OLAP tools support advanced analytical functions like trend analysis, predictive modeling, and what-if scenarios, which are crucial for forecasting future trends and planning accordingly.
- User-Friendly Interfaces: Many OLAP tools come with intuitive interfaces and visualization capabilities, making it easier for non-technical users to generate reports, create dashboards, and extract actionable insights without needing specialized training.
- Collaborative Decision-Making: OLAP tools often support collaboration, enabling teams to work together on data analysis, share insights, and make more informed, collective decisions that align with overall business objectives.
- Scalability: As your business grows, so does the volume of your data. OLAP tools are designed to handle large data sets efficiently, providing scalability to accommodate your evolving data analysis needs.
- Competitive Advantage: In today’s data-driven environment, having the ability to quickly analyze and act on information can provide a significant competitive edge. OLAP tools give businesses the agility to respond rapidly to market changes and capitalize on emerging opportunities.
OLAP tools are indispensable for businesses looking to harness the full potential of their data. By facilitating comprehensive and multi-dimensional analysis, these tools help organizations optimize their operations, enhance strategic planning, and ultimately achieve better business outcomes.
Who uses OLAP tools?
OLAP tools are most commonly used by business analysts to find answers to multi-dimensional queries. However, a data analyst may connect an OLTP (Online Transaction Processing) database to a cloud-based OLAP cube for computing-intensive queries or data analytics concerning historical data.
Many of the software options above are trying to empower non-technical users to utilize OLAP tools so they focus on drag-and-drop or natural language queries.
What are the 3 types of OLAP?
There are three main types of OLAP, which include:
- MOLAP: As the abbreviation for Multi-dimensional Online Analytical Processing, MOLAP contains data that is precomputed and fabricated from existing cubes. A MOLAP system will have a database server from which to collect data, a MOLAP server that hosts the data cubes, and a front-end tool where users see the answers to their queries presented.
- ROLAP: Relational Online Analytical Processing is a type of analytical processing where the data storage is done in a relational database management system (RDBMS). There it is arranged in columns and rows. As a user, you’ll see the data represented in multi-dimensional form when the ROLAP engine creates data cubes dynamically to answer your question.
- HOLAP: Hybrid Online Analytical Processing is designed to solve the limitations of ROLAP and MOLAP by combining their attributes. Your database will be divided into two parts — relational storage and specialized storage — and then integrated to address issues with scalability and performance.
Additional Revenue Operations Software
Are you looking for other BI tools to round out your tech stack? Take a look at these overviews to find the top SaaS options to fit your needs:
- Business Intelligence Software For RevOps
- Business Development Software
- Revenue Intelligence Platforms
- Sales Intelligence Software
- Predictive Analytics Software
- Sales Forecasting Software
Conclusion
As you review these OLAP options, consider the predictive analytics strategies you already have in place and what systems you’re currently using. You might be able to supplement or exchange your current digital tools with something from my list. Explore some free trials and demos to see which ones would integrate best with your workflow before deciding.
But The RevOps Team is here to provide so much more when it comes to enhancing revenue operations and improving your business model. If you’re interested in even more insights from the experts, sign up for the newsletter to get up-to-the-minute advice delivered to your inbox.