20 Best Mobile BI Software Reviewed For 2024

10 Best Mobile BI Software Shortlist
Here's my pick of the 10 best software from the 20 tools reviewed.


With so many different mobile BI software available, figuring out which is right for you is tough. You know you want to access, analyze, and visualize business data through your mobile devices but need to figure out which tool is best. I've got you! In this post I'll help make your choice easy, sharing my personal experiences using dozens of different mobile BI tools with various teams, with my picks of the best mobile BI software.
Why Trust Our Mobile BI Software Reviews?
We’ve been testing and reviewing mobile BI software since 2022. As revenue operation leaders ourselves, we know how critical and difficult it is to make the right decision when selecting software.
We invest in deep research to help our audience make better software purchasing decisions. We’ve tested more than 2,000 tools for different RevOps use cases and written over 1,000 comprehensive software reviews. Learn how we stay transparent & our mobile BI software review methodology.
| Tools | Price | |
|---|---|---|
| Domo | Pricing upon request | Website |
| Sisense | Pricing upon request | Website |
| Heap | Pricing upon request | Website |
| MicroStrategy | Pricing upon request | Website |
| IBM Cognos Analytics | From $10/user/month | Website |
| Dimensional Insight | Pricing upon request | Website |
| Yellowfin | Pricing upon request | Website |
| InetSoft Style Intelligence | From $165/month for unlimited users | Website |
| Dundas BI | Pricing upon request | Website |
| WebFOCUS Platform | Pricing upon request | Website |
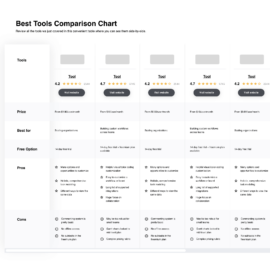
Compare Software Specs Side by Side
Use our comparison chart to review and evaluate software specs side-by-side.
Compare SoftwareHow To Choose Mobile BI Software
With so many different mobile BI software available, it can be challenging to make decisions on what tool is going to be the best fit for your needs.
As you're shortlisting, trialing, and selecting mobile BI software, consider the following:
- What problem are you trying to solve - Start by identifying the mobile BI software feature gap you're trying to fill to clarify the features and functionality the tool needs to provide.
- Who will need to use it - To evaluate cost and requirements, consider who'll be using the software and how many licenses you'll need. You'll need to evaluate if it'll just be the revenue operation leaders or the whole organization that will require access. When that's clear, it's worth considering if you're prioritizing ease of use for all or speed for your mobile BI software power users.
- What other tools it needs to work with - Clarify what tools you're replacing, what tools are staying, and the tools you'll need to integrate with, such as accounting, CRM, or HR software. You'll need to decide if the tools will need to integrate together or if you can replace multiple tools with one consolidated mobile BI software.
- What outcomes are important - Consider the result that the software needs to deliver to be considered a success. Consider what capability you want to gain or what you want to improve, and how you will be measuring success. For example, an outcome could be the ability to get greater visibility into performance. You could compare mobile BI software features until you’re blue in the face but if you aren’t thinking about the outcomes you want to drive, you could be wasting a lot of valuable time.
- How it would work within your organization - Consider the software selection alongside your workflows and delivery methodology. Evaluate what's working well and the areas that are causing issues that need to be addressed. Remember every business is different — don’t assume that because a tool is popular that it'll work in your organization.
Best Mobile BI Software Reviews
Are you ready to take a deep dive into the top mobile business intelligence tools? Take a look at each software on my list to find an overview of their functionality, a few standout features and integrations, pricing and trial offers, and several pros and cons to help you narrow down your options.

As a data management and intelligence tool designed to simplify your reporting workflow, Domo strives to deliver essential and actionable insights to the people who need them — no matter which device they’re using. User-friendly dashboards, automated report generation, and easy sharing on a variety of messaging platforms go above and beyond traditional BI platforms.
Why I picked Domo: This tool stood out to me because it helps you upgrade your reporting. Forget emailing static spreadsheets that are stale by the time you get around to meetings. Use Domo to aggregate, analyze, and share data with real-time updates to ensure fresh, meaningful information with automated notifications when things change.
Domo Standout Features and Integrations
Standout features include real-time dashboards and reporting for enhanced business decisions, drag-and-drop interface for ETL, and machine learning to get predictive analytics and forecasting.
Integrations include Basecamp, Dropbox Business, DocuSign, GitHub, Google Analytics, Google Drive, Jira, Microsoft Excel, SurveyMonkey, and Trello.
Pros and cons
Pros:
- Very intuitive and user-friendly
- No-Code SQL transformations
- Can access thousands of APIs
Cons:
- Number of functionalities can be overwhelming
- No linking for data sets
Sisense
Best for interactive visualizations on dashboards that speak to each other

This data and analytics solution is designed to make it easier to mashup data from across your entire data landscape for powerful analytics that you can embed anywhere. Sisense provides you with more flexibility with data sources that may be on-premise, in the cloud, or a hybrid mix of both.
Why I picked Sisense: This tool stood out to me because of its thoughtful approach to data visualization. While making beautiful charts and graphs is simple with templates and pre-built reporting tools, ensuring these visualizations interact with one another is crucial to gaining better actionable data. With Sisense you can drill down or filter into any insights to answer questions.
Sisense Standout Features and Integrations
Standout features include data warehouse capabilities with OLTP and OLAP, scalability on demand to expand as you do, and single- and multi-tenant setups on-premise or in the cloud.
Integrations include Access, Adobe Analytics, Bing Ads, Box, GitHub, HelpScout, HubSpot CRM, MixPanel, PostgreSQL, and Salesforce Sales Cloud. Sisense offers hundreds of connectors.
Pros and cons
Pros:
- Responsive customer support team
- Customizable dashboards and visualizations
- Very integratable with common databases
Cons:
- Installation and implementation require guidance
- Initial dashboard setup can be time-consuming

With digital insights available on all devices, Heap is a mobile BI software that focuses on the user experience and customer journey. As it identifies where in the journey users are struggling, Heap prompts you to make improvements to create a more enjoyable user experience. You can design a more personalized experience using insights from real actions taken on a site.
Why I picked Heap: One reason this platform made my list is because it offers session replay to provide full context for every user action. You can find the exact point in each session that matters to you, saving you effort and time. With session replay, you can better understand what users are doing and what leads them to leave your site without making a purchase.
Heap Standout Features and Integrations
Standout features include data science that removes blindspots to user behaviors and automated single snippet capture to see the entire digital experience of every user on every platform.
Integrations include AWS, Intercom, Iterable, Mailchimp, Marketo, Rippling, Salesforce Sales Cloud, Shopify, Snowflake, and WalkMe.
Pros and cons
Pros:
- Robust community and support teams
- Starts providing immediate feedback
- Quick and easy to use
Cons:
- Hybrid web-based setup requires extra configuration
- Only tracks front-end interactions

MicroStrategy is a cloud-based BI tool that’s designed to help business people make faster decisions with the use of self-service BI tools that provide access to data set exploration and new insights in just a few minutes. It’s usable on any operating system and has no usage limits to ensure effortless answers in everyday apps and websites.
Why I picked MicroStrategy: I chose this tool because it offers you more versatility with the ability to deploy it on any cloud provider. You don’t have to pay extra fees to this platform for data warehousing, you can utilize a service that’s already in your tech stack with zero additional effort or cost. This also means you don’t have to worry about overwhelming your phones and tablets with data storage.
MicroStrategy Standout Features and Integrations
Standout features include no-code UI for easy ad hoc reporting, automated and centralized security administration with reusable configurations, and dynamic and multi-page analytics that modify themselves for any device screen.
Integrations include Allego Sales Enablement, FoxPlan, LoginRadius, Microsoft 365, Microsoft Excel, Microsoft SharePoint, MongoDB, Salesforce Sales Cloud, Vibe, and Zeenea Data Discovery Platform.
Pros and cons
Pros:
- Friendly user-interface
- Simple installation and implementation
- Very customizable for dashboards and reports
Cons:
- Licensing costs are pretty high
- Interface look is a little outdated

The Cognos Software from IBM is their collection of SaaS BI tools targeted towards businesses of all sizes across a range of industries. This platform combines the standard BI features, including real-time monitoring, forecasting, and data visualization, with advanced tools, like performance scorecards, financial planning, and strategy management.
Why I picked IBM Cognos Analytics: Because this platform has built up its AI automation and insights, Cognos Analytics empowers everyone in your organization to make more data-driven decisions. With a natural language AI assistant, your data is easier to understand. You can also rely on AI to build data visualizations for you.
IBM Cognos Analytics Standout Features and Integrations
Standout features include automated data exploration to uncover hidden trends and governed self-service analytics that protect your data from misuse.
Integrations include CommandCenterHD, eCMS, Husky Intelligence, Key Survey, Limelight, Login ERP, MongoDB, OpenHR, SAP Fieldglass, and VisualCron.
Pros and cons
Pros:
- Intuitive user interface
- Very easy to automate reports
- No knowledge of SQL is needed
Cons:
- Works best within the IBM ecosystem
- Some issues with joining tables

This BI solution offers several pre-built solutions that can help you with data integration, analytics, and management. Some of the most popular applications they offer that can be useful in any industry include Diver Gateway, GL Advisor, DiveTab, and Inventory Advisor. The Diver Platform is especially useful for BI, as it offers business users tools for KPI analytics, report generation, data transformation, and collaboration.
Why I picked Dimensional Insight: This platform made my list because it offers access to live integrated data from every device, including laptops, tablets, and phones. Even with pre-built applications, you can customize your dashboards and reports for self-service capabilities that empower every user to take charge.
Dimensional Insight Standout Features and Integrations
Standout features include data governance that manages and protects your information, interactive reports that encourage collaboration, and interactive dashboards that explain new insights.
Integrations include Microsoft Excel and TeraVina.
Pros and cons
Pros:
- Plenty of customization options
- Can pull information from Big Data
- User-friendly interface and navigation
Cons:
- May require up to 20GB of storage space
- Works best on iOS

Yellowfin is a BI platform that strives to simplify the entire analytics workflow — from connecting to your data and preparing it to building dashboards and planning management strategies. This BI solution offers action-based dashboards, automated business monitoring, data stories, reports, and self-service BI.
Why I picked Yellowfin: Instead of just looking at the beautiful visualizations of your dashboard, Yellowfin stands out as a platform that encourages you to interact with and work from them. Trigger and support workflows directly from the dashboards, acting on data immediately to log a ticket or add a note without switching screens or applications.
Yellowfin Standout Features and Integrations
Standout features include narrative tools to share data in a meaningful way and plug-in dashboards that are completely customizable.
Integrations include GitHub, Google Analytics, Instagram, LinkedIn for Business, Meta for Business, Microsoft Azure, Salesforce Sales Hub, Tableau, Xero, and Zendesk Suite.
Pros and cons
Pros:
- Drag-and-drop functionality
- Intuitive user navigation
- Easy-to-understand interface
Cons:
- Load times can make editing reports slow
- Finding answers in the resources can be complicated

Style Intelligence from InetSoft is a BI and data mashup application that’s designed for large enterprises that need the most advanced tools for connecting data from separate sources to gain valuable insights. Utilize an interactive dashboard for visualizing data analytics and getting actionable next-steps.
Why I picked Style Intelligence: This platform made my list because of its iterative mashups and visualization that’s available on a web-based app. Accessible on mobile, you can use the mashup engine to quickly profile data, visualize data, and verify data manipulations.
Style Intelligence Standout Features and Integrations
Standout features include in-cloud and on-premise deployment options for better accessibility and OEM-friendly features with multi-tenant hosting and flexible license modeling.
Integrations include AWS, Google Analytics, Google Sheets, Microsoft Excel, Microsoft SharePoint, and Salesforce.
Pros and cons
Pros:
- Great support from account managers
- Large variety of visual elements to choose from
- Very easy to use the platform
Cons:
- Can take getting used to if you’re transitioning from Tableau
- Managing intricate data blocks can be difficult

With this browser-based business intelligence platform, you can access your dashboards, analytics, and reporting tools on any device with an internet connection. Dundas BI is designed to empower your team to quickly analyze, visualize, and view your data in meaningful and actionable ways.
Why I picked Dundas BI: One way this tool stands out from the pack is the robust training and e-learning tools they provide when you sign up. Using the Dundas BI eLearning and Certification, you access self-paced training and online certifications to enhance your understanding of the platform and your expertise in translating raw data.
Dundas BI Standout Features and Integrations
Standout features include customizable, low-code dashboards with graphical visualizations and out-of-the-box development experiences for software teams.
Integrations include Desktop.com, Google Analytics, Integrate.io, Microsoft Azure, Microsoft SharePoint, OpenBridge, Salesforce Sales Cloud, Vertica, and Xplenty Data Integration.
Pros and cons
Pros:
- Lots of video training and onboarding support
- Easy to run analytics and create visualizations
- Accessible on every device, including mobile
Cons:
- City-level maps aren’t included out-of-the-box
- Can’t export multiple slides to PowerPoint at once

As part of the newest development at Tibco, WebFOCUS is a uniquely immersive and responsive hub that provides access to the Tibco suite from every type of device. You’ll have navigation into all areas of the platform and full functionality for every feature.
Why I picked WebFOCUS: I picked this platform for my list because its entire purpose is mobile device accessibility. You can use WebFOCUS to distribute boardroom quality reports and consumer-facing apps, as well as create visualizations in wide range of formats to reduce device compatibility issues for both creators and consumers.
WebFOCUS Standout Features and Integrations
Standout features include sorting and filtering data both online and offline, fully supported native device navigation with gestures, menus, and controls, and native search capabilities to find and retrieve content.
Integrations include Microsoft Dynamics.
Pros and cons
Pros:
- Dedicated customer support team
- Scalable to any size organization
- Easy to use with drag-and-drop functionality
Cons:
- User interface is a little outdated
- New software that inevitably has some bugs
Other Mobile BI Software
Even though my list of BI tools is already exhaustive, I couldn’t resist adding a few more options to really ensure a comprehensive roundup:


Related Mobile BI Software Reviews
If you still haven't found what you're looking for here, check out these tools closely related to mobile BI software that we've tested and evaluated.
- Sales Software
- Lead Management Software
- Business Intelligence Software
- Contract Management Software
- Revenue Management System
- CPQ Software
Selection Criteria For Mobile BI Software
Selecting the ideal mobile Business Intelligence (BI) software requires a deep dive into the functionalities that align with your organizational goals, particularly in the context of managing revenue operations effectively. Through hands-on trials and comprehensive research, I've developed criteria essential for evaluating mobile BI tools. These criteria are tailored to ensure the chosen solution not only addresses common software buyer needs and pain points but also excels in providing actionable insights and fostering data-driven decision-making.
Core Mobile BI Software Functionality: 25% of total weighting score
To be considered for inclusion on my list of the best mobile BI software, the solution had to support the ability to fulfill common use cases:
- Real-time monitoring of sales and revenue data.
- Accessing and sharing reports and dashboards on the go.
- Customizing data views and dashboards for different user roles.
- Analyzing customer behavior and market trends to inform strategic decisions.
- Integrating with CRM and ERP systems for a unified view of business operations.
Additional Standout Features: 25% of total weighting score
Innovative features set top contenders apart:
- Advanced AI and machine learning for predictive analytics.
- Natural language processing for easy querying of data.
- Augmented reality data visualizations for immersive insights.
- Custom app development capabilities within the platform.
- Blockchain integration for secure and transparent data sharing.
Usability: 10% of total weighting score
Key usability factors include:
- Intuitive design that simplifies navigation and data interaction.
- Responsive design for a seamless experience across all mobile devices.
- Personalization options that cater to individual user preferences.
- Quick access to frequently used reports and dashboards.
Onboarding: 10% of total weighting score
Effective onboarding strategies are crucial:
- Comprehensive training materials, like video tutorials and written guides.
- Easy-to-follow setup wizards for quick initial configuration.
- Direct support options, including chatbots and live support for immediate assistance.
- Community forums for user-driven insights and problem-solving.
Customer Support: 10% of total weighting score
Exemplary customer support is characterized by:
- Multiple support channels tailored to different urgency levels.
- Proactive customer service that anticipates and addresses potential issues.
- Dedicated account management for personalized assistance.
- Regular, informative updates about new features and improvements.
Value For Money: 10% of total weighting score
Assessing value involves:
- Transparent pricing that aligns with the features and benefits offered.
- Scalable pricing models that grow with your business needs.
- Free trials or demos to evaluate the software's impact before investment.
- A clear ROI, demonstrated through efficiency gains and actionable insights.
Customer Reviews: 10% of total weighting score
Gleaning insights from customer reviews focuses on:
- Overall satisfaction with the software’s performance and reliability.
- Specific benefits users have gained from using the software in their operations.
- Feedback on the learning curve and ongoing usability.
- Testimonials about customer service experiences and problem resolution.
By rigorously applying these criteria, I guide software buyers towards mobile BI solutions that not only meet but exceed their expectations for managing revenue operations. The right mobile BI tool empowers organizations to access, analyze, and act on critical business data anytime, anywhere, driving informed decisions that enhance performance and competitiveness.
Trends In Mobile BI Software For 2024
Through a detailed review of the latest product updates, press releases, and release logs from the leading mobile BI tools, several key trends have emerged. These trends not only reflect the evolving needs of businesses in leveraging data but also highlight the shift towards more dynamic, intuitive, and predictive analytics capabilities.
Enhanced Real-time Data Analytics:
- Real-time data processing and analytics have become more sophisticated, enabling businesses to make faster, more informed decisions directly from their mobile devices. This evolution addresses the need for immediate insights into sales, customer behavior, and market trends.
Increased Use of AI and Machine Learning:
- AI and machine learning features are rapidly evolving within mobile BI software, offering predictive analytics, automated data cleansing, and intelligent recommendations. These advancements are crucial for businesses looking to anticipate market shifts and optimize revenue operations proactively.
Most Important and In Demand Features
Seamless Cross-Platform Accessibility:
- The ability to access and interact with BI tools across various devices without loss of functionality or data integrity is highly valued. This feature ensures that decision-makers can stay informed, regardless of their physical location or the device they're using.
Customizable Reporting and Dashboards:
- Customizable reporting features and dashboards allow users to tailor their analytics experience, focusing on the metrics that matter most to their specific role or business goals. This customization is key for efficiently monitoring and managing revenue operations.
Novel and Unusual Functionality
Augmented Reality (AR) for Data Visualization:
- Some mobile BI tools are incorporating AR to offer immersive data visualization experiences, allowing users to interact with data in three-dimensional space. This innovative approach can transform complex data sets into more understandable and actionable insights.
Features Becoming Less Important
Static Reporting:
- As dynamic and interactive reporting capabilities become more sophisticated, the demand for static, one-size-fits-all reports is diminishing. Businesses now require flexible reporting that can adapt to changing data and business needs.
The trends in mobile BI software highlight a shift towards tools that not only provide deeper insights and predictive analytics but also emphasize user accessibility, real-time data analysis, and innovative visualization techniques. For revenue operation leaders, selecting a mobile BI tool that aligns with these trends will be essential for navigating the complexities of today's business landscape and driving sustainable growth.
What Is Mobile BI Software?
Mobile Business Intelligence (BI) software is a type of application that allows users to access and analyze business data through their mobile devices. It extends the functionality of traditional BI systems, offering tools for data visualization, reporting, and analysis optimized for smartphones and tablets. This software enables real-time access to key business metrics and interactive dashboards, facilitating on-the-go data analysis and decision-making.
The benefits of mobile BI software include enhanced accessibility and convenience, allowing business professionals to stay informed and make data-driven decisions from anywhere. It supports timely decision-making with real-time data access and improves collaboration by enabling team members to share insights remotely. Mobile BI software increases overall productivity by providing immediate access to business intelligence, enabling quick responses to market changes and business challenges. It is particularly valuable for professionals who require constant access to data and insights in a fast-paced business environment.
Features Of Mobile BI Software
Mobile Business Intelligence (BI) software has become indispensable for managing revenue operations effectively. These tools empower decision-makers with real-time insights, predictive analytics, and comprehensive data visualizations, all accessible from the convenience of a mobile device. As we delve into the essential features of mobile BI software, it's clear that certain functionalities stand out for their ability to enhance decision-making, improve operational efficiency, and ultimately drive revenue growth. Here are the most important features to consider:
- Real-Time Data Access: Enables immediate access to up-to-date business data. This feature is crucial for making informed decisions on the fly, allowing businesses to respond swiftly to market changes and operational challenges.
- Interactive Dashboards: Provide a customizable and interactive interface for data analysis. Interactive dashboards allow users to drill down into the specifics of their data, making it easier to uncover actionable insights and monitor key performance indicators (KPIs) critical to revenue operations.
- Predictive Analytics: Utilizes historical data to forecast future trends. Predictive analytics can identify potential revenue opportunities and risks, guiding strategic planning and decision-making processes.
- Cross-Platform Compatibility: Ensures seamless functionality across various devices and operating systems. This feature ensures that stakeholders can access vital business intelligence regardless of their chosen device, maintaining productivity and informed decision-making on the go.
- Collaboration Tools: Facilitate sharing insights and reports among team members. Collaboration tools are essential for aligning strategies across departments, fostering a unified approach to managing revenue operations.
- Data Integration Capabilities: Supports integrating data from multiple sources, including CRM, ERP, and social media. A comprehensive view of data from various sources is vital for understanding all aspects of revenue operations and making informed decisions.
- Customizable Reporting: Allows users to create reports tailored to their specific needs. Customizable reporting enables businesses to focus on the metrics that matter most to their revenue operations, ensuring that reports are both relevant and actionable.
- User Access Controls: Manage user permissions and access to sensitive data. This feature is important for maintaining data security and compliance, especially when handling sensitive financial information.
- Offline Access: Provides access to data and reports even without an internet connection. Offline access ensures that decision-makers can always access critical information, regardless of connectivity issues.
- Scalability: Adapts to the growing amount of data and users as the business expands. Scalability is crucial for ensuring that the BI software can continue to meet the needs of the business as it grows, without performance degradation.
Selecting the right mobile BI software involves looking for features that not only provide deep insights into revenue operations but also offer flexibility, scalability, and real-time capabilities. By focusing on tools that embody these functionalities, businesses can equip themselves with the intelligence needed to navigate the complexities of the market and steer their operations towards sustained growth.
Benefits Of Mobile BI Software
The ability to access and analyze data on the go has become a necessity for effective revenue operations management. Mobile Business Intelligence (BI) software meets this need by providing powerful analytics capabilities directly through mobile devices, ensuring that decision-makers have the information they need, whenever and wherever they need it. Here are five primary benefits of mobile BI software for users and organizations, highlighting why it is an invaluable tool for anyone looking to optimize their revenue operations.
- Real-Time Decision Making: Mobile BI software enables access to real-time data analytics and insights. This immediacy allows users to make informed decisions quickly, a crucial advantage in dynamic market conditions where delays can cost opportunities.
- Increased Productivity: With the ability to analyze data and generate reports directly from a mobile device, users can remain productive regardless of their location. This flexibility ensures that decision-making and strategic planning can continue uninterrupted, even when away from the office.
- Improved Collaboration: Many mobile BI solutions offer collaborative features that enable teams to share insights and reports easily. Enhanced collaboration leads to better-aligned strategies across departments, improving overall business efficiency and effectiveness.
- Customized Alerts and Notifications: Users can set up customized alerts for key performance indicators, ensuring they are immediately notified of significant changes. This feature helps businesses respond more swiftly to potential issues or opportunities, protecting and maximizing revenue.
- Accessible and User-Friendly: Mobile BI software is designed for accessibility, offering intuitive interfaces and visualization tools that make complex data easy to understand. This user-friendliness ensures that all team members, regardless of their technical expertise, can leverage BI insights to contribute to revenue operations.
Costs & Pricing For Mobile BI Software
Selecting the right mobile Business Intelligence (BI) software is a pivotal decision for organizations aiming to enhance their data analytics and reporting capabilities on the go. Mobile BI tools vary widely in their features, scalability, and pricing models, catering to businesses of all sizes and industries. Understanding the different plan options and their respective pricing is crucial for making an informed decision that aligns with your organization's needs and budget constraints. Below is a breakdown of common plan options for mobile BI software, designed to help potential buyers navigate their choices.
Plan Comparison Table For Mobile BI Software
| Plan Type | Average Price | Common Features Included |
|---|---|---|
| Starter | $10 - $50 per user/month | Basic analytics, standard reporting, access on multiple mobile devices, limited data sources integration |
| Professional | $50 - $150 per user/month | Advanced analytics, customized reporting, increased data sources integration, collaboration features |
| Enterprise | $150 - $500+ per user/month | Full suite of analytics and reporting features, unlimited data sources, dedicated support, enhanced security |
| Free | $0 | Basic analytics and reporting capabilities, limited access, community support only |
When choosing a mobile BI software plan, consider both the current and anticipated future analytics needs of your organization, as well as the level of support and security required. Balancing these factors against the available budget will guide you to the most suitable plan, ensuring that you invest in a solution that offers the best value and aligns with your business objectives.
Mobile BI Software Frequently Asked Questions
If you still have questions about mobile business intelligence software, keep reading to find my answers to the most frequently asked questions.
What are the types of mobile BI software?
Mobile Business Intelligence (BI) software has become an indispensable tool for organizations seeking to access, analyze, and leverage business data from anywhere, at any time. This type of software varies in capabilities, features, and use cases, catering to the diverse needs of businesses across sectors. Understanding the types of mobile BI software can help organizations choose the right solution to support their decision-making processes and strategic goals. Here are the primary types of mobile BI software:
- Dashboard and Visualization Tools: These mobile BI applications focus on delivering data through interactive dashboards and visual representations, such as graphs and charts. They are designed for users who need at-a-glance insights and the ability to drill down into data for more detailed analysis.
- Reporting Tools: This type of mobile BI software emphasizes generating and distributing standard and custom reports. Users can create, view, and share reports directly from their mobile devices, ensuring that stakeholders have timely access to critical information.
- Self-service BI Tools: Self-service mobile BI software empowers users with little to no technical expertise to create their own reports and analyses without relying on IT departments. These tools are characterized by their user-friendly interfaces and drag-and-drop functionalities.
- Predictive Analytics Tools: These applications extend beyond traditional BI to offer predictive insights based on historical data analysis. They use statistical models and machine learning algorithms to forecast future trends, helping businesses anticipate market changes and make proactive decisions.
- Collaborative BI Tools: Focused on enhancing communication and collaboration among teams, these mobile BI tools integrate features like shared dashboards, comment sections, and notification systems. They facilitate a more coordinated approach to data-driven decision-making.
- Real-time BI Tools: Offering the capability to analyze and report data in real-time, these tools are crucial for businesses that require immediate insights for quick decision-making. They are particularly useful in dynamic industries where conditions change rapidly.
- Operational BI Tools: These are designed to integrate with operational systems, such as CRM and ERP, to provide real-time analytics that support day-to-day business operations. Operational BI tools help in monitoring current performance and making immediate adjustments.
- Embedded BI Tools: Embedded mobile BI software is integrated directly into other business applications or platforms, providing analytics and reporting capabilities within the context of the application being used. This seamless integration enhances the utility and accessibility of BI features.
Selecting the right type of mobile BI software depends on various factors, including the specific business needs, the technical expertise of users, the volume and complexity of data, and the desired level of mobility. By carefully assessing these aspects, organizations can identify the most suitable mobile BI solution to support their strategic objectives and drive informed decision-making.
Who uses mobile BI software?
Mobile BI is useful across a number of industries and roles. You may find a university president tracking security on campus through remote viewing of real-time data on reported incidents and crowd size. Or, a hospital admin out of town can still make informed staffing decisions since they have access to room usage and availability data on their mobile app.
What else can you use business intelligence software for?
Business intelligence tools are designed to collect and sort data to provide your team with unique insights to improve your business strategies. They offer data visualization, performance management, reporting tools, text mining, and predictive analytics. These business intelligence solutions can also provide automation and machine learning tools for AI-driven data.
Additional Revenue Operations Software
Are you looking for other business analytics tools to round out your tech stack? Take a look at overviews for the top analytics software options here:
- Cloud BI Tools
- Corporate Performance Management Software
- Revenue Intelligence Platforms
- Visual Analytics Tools
- Sales Analytics Software
- Predictive Analytics Software
Conclusion
With all this information on mobile access for business intelligence platforms, you can start making some decisions on the analytics solutions you want to include in your tech stack. Reach out to schedule free demos or start free trials to see which of these options works best for your organization in the real world.
And if you’re looking for more expert advice in the revenue operations niche, I’m always here to help. Explore the blog for more tool overviews, or sign up for the RevOps newsletter to get these insights directly to your inbox on a weekly basis.