20 Best Visual Analytics Tools Reviewed For 2024

10 Best Visual Analytics Tools Shortlist
Here's my pick of the 10 best software from the 20 tools reviewed.


With so many different visual analytics tools available, figuring out which is right for you is tough. You know you want to use visualization techniques to analyze and understand complex data sets but need to figure out which tool is best. I've got you! In this post I'll help make your choice easy, sharing my personal experiences using dozens of different visual analytics tools with various teams and data sets, with my picks of the best visual analytics tools.
What Are Visual Analytics Tools?
Visual analytics tools are software applications that enable the analysis and interpretation of complex data sets through graphical representations. These tools transform data into visual formats like charts, graphs, and maps, making it easier to identify patterns, trends, and correlations. They offer interactive dashboards and features for real-time data analysis, integrating data from multiple sources to create comprehensive visualizations.
The benefits of visual analytics tools lie in their ability to simplify complex data analysis, making it accessible to a broader range of users, not just data specialists. They facilitate faster and more intuitive insights, enhancing decision-making processes by allowing users to see and interact with data in a more digestible format. This leads to a deeper understanding of data, improved data-driven decision-making, and the ability to quickly identify and respond to emerging trends and anomalies. These tools are particularly valuable in environments where quick, informed decisions are crucial and where data is too complex to be easily understood in raw form.
Overviews Of The 10 Best Visual Analytics Tools
You can start your hunt for a visual analytics tool with an overview of my recommendations that includes a summary, some of the outstanding features from each tool, the most common integrations, a pricing breakdown, and a few pros and cons.
Infogram
Best for creating engaging infographics and reports in just a few minutes

As a web-based infographic creation tool, Infogram focuses on data visualization through interactive dashboards, graphics, reports, and content that strives to drive more traffic to your site. With a lightweight editor, you can customize everything about your data visualizations, including style, color, logos, and display options, as well as royalty-free images, GIFs, and icon usage.
Why I picked Infogram: I like this tool because it’s the solution with the most templates available for easy insertion. Infogram has over 550 maps, 35 charts, and 20 pre-built design templates, images, and icons for drag-and-drop editing. Combine these templates with data from multiple sources, and you can get results directly in the editor through native integrations, cloud services, and spreadsheet uploads.
Infogram Standout Features and Integrations
Standout features include drag-and-drop editing format to simplify interactive chart and graphic creation, live data feeds that update your visualizations in real-time with no manual work needed, and simplified publishing to your website or social media channels through AMP, Medium Stories, or CMS.
Integrations include Brandcast, Dropbox, Genially, Giphy, Google Drive, Google Sheets, JSON feed, Microsoft OneDrive, MySQL, and YouTube.
Pros and cons
Pros:
- Very user-friendly with a short learning curve
- Customizable themes for any industry or purpose
- Massive selection of templates
Cons:
- No offline functionality or features
- Not ideal for printed media
Best for connecting all your data sources to one visual analytics tool
As a metric-centric BI and analytics platform, Klipfolio prioritizes getting your data centralized in one place through versatile, flexible integrations. Once your data is on Klipfolio, you can use data preparation, cleaning, and visualization tools to develop custom dashboards and reports to keep your team informed and motivated.
Why I picked Klipfolio: This visual analytics tool deserves a spot on my list because of the PowerMetrics feature. This self-serve tool encourages teams to explore and track their business data, instantly segmenting and filtering the information in a way that provides more actionable insights. You can also preserve your historical data for better forecasting and trend spotting.
Klipfolio Standout Features and Integrations
Standout features include custom metric creation for instant calculations, continual data updates using your data feeds, and a metric warehouse for data storage, accessibility, and management.
Integrations include Google Drive, HubSpot CRM, Intercom, Intuitive, Jira, LiveAgent, Mailchimp, Microsoft Excel, Slack, and Trello. Klipfolio has pre-built connectors and REST API integrations, as well as connection for spreadsheets, JSON files, and SQL databases.
Pros and cons
Pros:
- Simple to set up and implement
- Easy connections and integrations
- Very user-friendly interface
Cons:
- Free plan has a lot of limitations
- Data refresh rates based on tiered pricing
Best for two-way reports that strive to improve productivity

As a visual analytics tool that prioritizes two-way communication, Easy Insight is designed to track key metrics across your entire organization to help drive goals forward. You can connect with a massive range of SaaS applications with just a few clicks and use prebuilt dashboards to help you see your data right away — no coding necessary.
Why I picked Easy Insight: A feature that made me add this tool to my list is the focus on two-way reporting and communication. All of your SaaS data integrates directly into reports in real time so you can filter down tasks throughout multiple projects and pipelines for more accuracy and faster decision-making.
Easy Insight Standout Features and Integrations
Standout features include embedded analytics on custom dashboards, prebuilt dashboard templates, and custom reports with your choice of bars, graphs, maps, and charts.
Integrations include Asana, Basecamp, Cin7, Jira, Katana, Mailchimp, Salesforce Sales Cloud, SurveyMonkey, Trello, and Xero.
Pros and cons
Pros:
- Responsive customer support
- Seamless data integration
- User-friendly interface
Cons:
- Limited formatting functionality for dashboards
- Number of SaaS connections limited by plan type

This visual analytics tool strives be your comprehensive dashboard app for monitoring and analyzing data from disparate sources in one single location. You can use the various tools from Cyfe to develop dashboards for every purpose, including focusing on clients, web analytics, social media, and marketing.
Why I picked Cyfe: One cool feature from this platform is the Starter Dashboard, where you can get set up in just a few minutes. With this type of dashboard you configure pre-populated widgets that automatically pull data and build your dashboard for you. You can then update and edit the dashboard to better fit your needs.
Cyfe Standout Features and Integrations
Standout features include pre-built widgets that pull data from other popular tech tools, automated report creation and notifications, and historical data management for reliable storage and reference.
Integrations include Facebook, Google Ads, Google Analytics, Mailchimp, PayPal, Salesforce Sales Cloud, Slack, Trello, Twitter, and WordPress.
Pros and cons
Pros:
- Simple and straightforward to use
- Massive amount of integration options
- One-click widget creation
Cons:
- No mobile application, desktop only
- Limited reporting customization options

This analytics platform is designed to help your managers and team leads surface live data for their team and share it across the entire organization. You can build visualizations directly in your dashboard using a drag-and-drop interface to highlight the essentials with bar charts, infographics, and other interactive visualizations.
Why I picked Geckoboard: The platform made my list because of its sharing features, including the ability to share dashboards directly to Slack or to other devices. Automate KPI reports for your remote team that regularly posts to your Slack channels or sends your data to the big screen for in-office updates and meetings.
Geckoboard Standout Features and Integrations
Standout features include customizable dashboards for reporting by team or department, ad hoc analysis that pulls information from a variety of data sources, and visual analytics with charts, graphs, and maps.
Integrations include ActiveCampaign, Asana, Campaign Monitor, Dixa, Freshdesk, Google AdSense, Highrise, Intercom, monday.com, and Pipedrive. Geckoboard has over 80 pre-built integrations.
Pros and cons
Pros:
- Robust tutorials and customer support
- Huge list of built-in integration options
- Implementation and launch in just a few minutes
Cons:
- Limited visualization template options
- Cost is higher than other similar platforms
Grow BI is an analytics and visualization platform that uses full-stack BI to empower everyone on your team to make data-based decisions. This tool combines ETL, visualizations, and data warehousing into one platform that helps your organization connect, explore, and experiment with data to surface new insights that encourage everyone to take action.
Why I picked Grow BI: The unique thing about this tool is its pricing model. Most of the software options on this list limit the number of users that have access based on a user-licensing model. With Grow BI, you have unlimited user licensing that provides access to your entire organization so nobody needs to wait on a data analyst for information.
Grow BI Standout Features and Integrations
Standout features include interactive visualizations for dashboards and reporting, point and click tools that eliminate the need for SQL queries, and automated data pipelines that refresh your data on a schedule.
Integrations include Dropbox, Facebook Ads, Google Analytics, Google Sheets, HubSpot CRM, Instagram, MySQL, QuickBooks Online, Salesforce Sales Cloud, and Stripe. Grow BI offers native integrations for over 40 apps.
Pros and cons
Pros:
- Lots of native integration options
- Digestible data bites for dashboards and reports
- Easy to use features and functionality
Cons:
- Limited export capabilities
- No storytelling or insight features
GoodData
Best for leveraging cloud BI and artificial intelligence for analytics

No HTML knowledge needed when using this visual analytics platform. With GoodData, you get cloud-based business intelligence and analytics that provides real-time insights and the ability to deploy custom-built dashboards across private, public, and hybrid cloud environments to ensure more flexibility for client-facing organizations.
Why I picked GoodData: This tool caught my eye because you can augment your analytics to ensure a better user experience through custom ML and AI capabilities, including natural language chatbots or query that uses GoodData’s open-source SDKs to make data more approachable and accessible for everyone.
GoodData Standout Features and Integrations
Standout features include premium data security including HIPAA, SOC 2, GDPR, CCPA, and ISO 27001 and developer features including SDKs, declarative definitions, and integration with CI/CD pipelines.
Integrations include Accesso ShoWare, Clever Maps, Fat Finger, Influitive, PostgreSQL, Salesforce Sales Cloud, Snowflake, Spoke Phone, Totango, and Trakstar Learn.
Pros and cons
Pros:
- Data refreshes every 15 minutes
- Easy to navigate and use
- No coding needed, but technical features are available
Cons:
- Limited tutorials for learning advanced features
- Pricing may be high for smaller businesses
Best for controlling every aspect of your data visualization with custom options

This web-based visual analytics tool is designed to empower your team to easily import data, create customized charts, and share their data visualizations throughout the entire organization. With various import options, including spreadsheets, manual entry, and databases, as well as hundreds of design pre-sets, ChartBlocks helps you quickly visualize your data to tell a story.
Why I picked ChartBlocks: I think this tool deserves a spot on my list because of the plethora of available customizations. With ChartBlocks you can optimize your data and find the best way to visualize it through dozens of graphs and charts and hundreds of single-click pre-sets. Choose from line graphs, scatter plots, heat maps, and histograms to bring your data to life.
ChartBlocks Standout Features and Integrations
Standout features include chart sharing tools through embedding on websites or social media posting, chart exporting as editable vector graphics to optimize them for presentations and printing, and no-code building with point-and-click functionality.
Integrations include Bit.ai, Ceros, Confluence, Facebook, Pinterest, Turtl, and Twitter. ChartBlocks also has an API for additional integrations.
Pros and cons
Pros:
- Free version is available
- Editable and reconfigurable charts
- Easy to import or upload data
Cons:
- Low export quality for cheaper plans
- Not ideal for big data uploads

As a cloud-based business intelligence tool, Exago BI offers a comprehensive platform for data analysis and visualization through ad hoc reporting, interactive visualizations, and dashboard creation. Using this platform, you can design custom reports with embedded maps, charts, graphs, and tables to help you combine operational reporting with dashboards and visualizations.
Why I picked Exago BI: One of the unique features from this platform is the ability to create your dashboards directly in Excel. Analyze your metrics without needing access to the data structure in your ERP. Simply drag the data you want to analyze and create dashboards when you drop it into Excel.
Exago BI Standout Features and Integrations
Standout features include access through mobile devices, on the web, and in Excel, Logi Symphony for embedded analytics in any dashboard, and dashboard building directly in Excel.
Integrations include 24SevenOffice, Accounting CS, Blackbaud, CDK Global, Datatel, Emphasys, HCS, IBM Cognos TM1, JobBOSS, and Mapics.
Pros and cons
Pros:
- Massive add-on library for additional tools
- Knowledgeable customer support team
- Robust tutorials and guides
Cons:
- Visualization-only tool with limited analytics capabilities
- Pretty intense learning curve

This visual reporting tool provides you with a way to enrich your reports through interactive, responsive visualizations with single-click functionality. Datawrapper helps you showcase your data using beautiful maps, tables, and charts that improve all web-based reports.
Why I picked Datawrapper: This tool made my list because it provides you with unprecedented control over your branding. Once you integrate your company style and aesthetic into the design of your templated graphics, everyone on your team can create tables and charts that represent your company more cohesively.
Datawrapper Standout Features and Integrations
Standout features include white label brand design for more control over your branding, live data feeds to keep up with your sources, and interactive presentations that allow you to zoom, hover, and highlight.
Integrations include Microsoft Powerpoint, Slack, and Teams. Datawrapper also has an API that’s designed to be used in server-side scripts to integrate with your CMS and programmatically interface with your charts, graphs, and maps.
Pros and cons
Pros:
- Robust customizable branding options
- Responsive designs for mobile, tablet, and desktop
- Quick and simple visualization templates
Cons:
- Some design and editing features are clunky
- Limited native connection options
| Tools | Price | |
|---|---|---|
| Infogram | From $25/month | Website |
| Klipfolio | From $99/month (billed annually) | Website |
| Easy Insight | From $49/month | Website |
| Cyfe | From $19/month | Website |
| Geckoboard | From $39/month | Website |
| Grow | From $1,500/month | Website |
| GoodData | From $1000/month | Website |
| ChartBlocks | No price details | Website |
| Exago BI | Custom pricing | Website |
| Datawrapper | From $599/month or $5,990/year | Website |
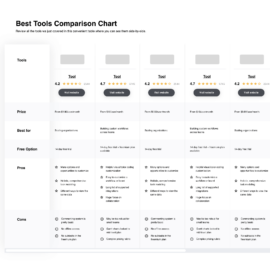
Compare Software Specs Side by Side
Use our comparison chart to review and evaluate software specs side-by-side.
Compare SoftwareOther Options
While my list is already pretty comprehensive, I couldn’t finish this article without mentioning at least a couple more. Check out a few other visual analytics tools that may be the right fit for you.


Selection Criteria For Visual Analytics Tools
Here’s a short summary of the main selection and evaluation criteria I used to build my list of the best visual analytics tools for this article:
Core Functionality
The best visual analytics tools, including the ones on my list, must have certain core functionalities to deliver the insights and value you need. As you research the data analytics and Business Intelligence tools that work for you, make sure they can do the following:
- Visual interface that doesn’t require SQL clauses
- Simplified chart and report creation
- Enhanced sharing and collaboration
- Connections that allow for data blending
- Data cleaning, preparation, and management
Key Features
To ensure the functionalities above, you’ll see that many of the tools on my list have the same features, including:
- No-code interface: These platforms will offer drag-and-drop or point-and-click editing gestures for data manipulation.
- Chart template library: You can pull charts, graphs, and maps from a selection of themes for presentations.
- Multi-user licensing: Paying per user will allow many people throughout your organization to see and access visualizations.
- Data cleanup: This tool will automatically normalize fields and remove trailing spaces to prep your data for analysis.
- Data cache in memory: Process data via RAM instead of writing it to disk for faster processing of large data sets.
Usability
Because you already have so many digital tools, adding one more to your tech stack shouldn’t be a hassle. I prioritized tools that had simple (or guided) implementation, a low barrier for entry, and intuitive navigation. Some tools have other standout usability features, like robust online training, outstanding customer support, or an involved and knowledgeable user community.
Software Integrations
I’ve already talked about some of the essential features for your data visualization tools, but I haven’t mentioned integrations. This is a critical aspect of visual analytics tools because you need to pull data from as many sources as possible to ensure accuracy in real time. I’ve listed the most popular integrations for each platform to help you see whether it will work with what you already have.
Pricing
There is a lot of variation in the performance of visual analytics tools, so pricing has quite a range as well. Some tools have user-based subscription pricing, while others offer limitless users for a high monthly fee. You can expect user-based pricing to range between $20 and $200 per month, and unlimited user-based pricing to range between $400 and $1,500 per month.
People Also Ask
Still trying to wrap your head around all the business intelligence platform options? Let’s break it down a little with some answers to the most frequently asked questions.
What are the benefits of visual analytics tools?
There are several benefits to using visual analytics tools, including better decision-making that’s based on in-depth data modeling, simplified trend analysis and exploration with automation and AI, faster identification of correlations through data storytelling, and insight into hidden patterns and trends with automated reporting that contextualizes results.
Who uses visual analytics tools?
Many industries use visual analytics tools to enhance their decision-making, including sales, marketing, IT, supply chain, human resources, and finance. These tools are designed to make data easier to understand, even for users who aren’t data scientists.
While some technical knowledge is helpful, everyone from the owner and team leads to salespeople should be able to take beneficial action that helps you achieve your KPIs with the help of data analytics tools.
What are the three types of data visualization tools?
There are three main ways to visualize your data, including charts, maps, and tables. Charts will display data in pie charts, graphs, plots, and diagrams. Maps show your data geospatially with color coding, icons, and markers. Tables visualize your data numerically in columns and rows, like an Excel spreadsheet.
Other Revenue Operations Software
Do you still need a few other revenue operations apps to round out your tech stack? Check out these platform breakdowns to find other key tools:
- Sales Analytics Software
- Predictive Analytics Software
- Data Visualization Software
- Cloud BI Tools
- Strategic Planning Software
- Sales Forecasting Software
What’s Next
If you’ve found a few tools on my list that seem like they would integrate well with your workflow, it’s time to test them out with free trials and demos if available. Put these platforms through their paces to see if they can deliver enhanced performance and encourage data-driven decision-making throughout your organization.
And if you’re looking for more revops insights, sign up for our newsletter to get the latest from industry insiders straight to your inbox.