20 Best KPI Software Reviewed For 2024

10 Best KPI Software Shortlist
Here's my pick of the 10 best software from the 20 tools reviewed.


With so many different KPI software available, figuring out which is right for you is tough. You know you want to measure performance against specific goals and objectives efficiently but need to figure out which tool is best. I've got you! In this post I'll help make your choice easy, sharing my personal experiences using dozens of different KPI tools with various teams, with my picks of the best KPI software.
Why Trust Our KPI Software Reviews?
We’ve been testing and reviewing KPI software since 2022. As revenue operation leaders ourselves, we know how critical and difficult it is to make the right decision when selecting software.
We invest in deep research to help our audience make better software purchasing decisions. We’ve tested more than 2,000 tools for different RevOps use cases and written over 1,000 comprehensive software reviews. Learn how we stay transparent & our KPI software review methodology.
| Tools | Price | |
|---|---|---|
| Klipfolio | From $99/month (billed annually) | Website |
| datapine | From $249/month | Website |
| Geckoboard | From $39/month | Website |
| HandyKPI | From $5/user/month | Website |
| KPI Fire | Pricing upon request | Website |
| Target Dashboard | From $159/month | Website |
| Dasheroo | From $19/month | Website |
| Scoro | From $30/user/month (billed annually) | Website |
| InfoCaptor | From $6.50/month | Website |
| SimpleKPI | From $99/month | Website |
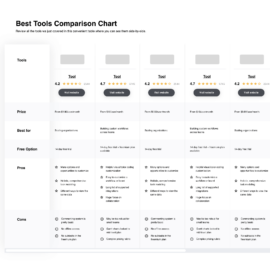
Compare Software Specs Side by Side
Use our comparison chart to review and evaluate software specs side-by-side.
Compare SoftwareHow To Choose KPI Software
With so many different KPI software available, it can be challenging to make decisions on what tool is going to be the best fit for your needs.
As you're shortlisting, trialing, and selecting KPI software, consider the following:
- What problem are you trying to solve - Start by identifying the KPI software feature gap you're trying to fill to clarify the features and functionality the tool needs to provide.
- Who will need to use it - To evaluate cost and requirements, consider who'll be using the software and how many licenses you'll need. You'll need to evaluate if it'll just be the revenue operation leaders or the whole organization that will require access. When that's clear, it's worth considering if you're prioritizing ease of use for all or speed for your KPI software power users.
- What other tools it needs to work with - Clarify what tools you're replacing, what tools are staying, and the tools you'll need to integrate with, such as accounting, CRM, or HR software. You'll need to decide if the tools will need to integrate together or if you can replace multiple tools with one consolidated KPI software.
- What outcomes are important - Consider the result that the software needs to deliver to be considered a success. Consider what capability you want to gain or what you want to improve, and how you will be measuring success. For example, an outcome could be the ability to get greater visibility into performance. You could compare KPI software features until you’re blue in the face but if you aren’t thinking about the outcomes you want to drive, you could be wasting a lot of valuable time.
- How it would work within your organization - Consider the software selection alongside your workflows and delivery methodology. Evaluate what's working well and the areas that are causing issues that need to be addressed. Remember every business is different — don’t assume that because a tool is popular that it'll work in your organization.
Best KPI Software Reviews
If you’re ready for more specifics about each tool on my shortlist, you can dive into the details below. If you need a little more context for how KPI dashboard software can help your organization, move on down to the frequently asked questions to learn about measuring KPIs, creating dashboards, and the benefits of KPI software.
Klipfolio is first and foremost an analytics and BI platform designed to help drive business decisions. It allows you to connect with any of your data sources and centralize them in one place to visualize, experiment, and distribute the data as needed. You can build visualizations into your custom dashboards and reports with formulas and functions.
Why I picked Klipfolio: One of the coolest features from Klipfolio is their Create-a-Metric tool, which functions as a metric library for custom, instant, or calculated metrics. Each of the three paths to metric creation have their own benefits to deliver tailored data, faster results, or flexibility to combine metrics.
Klipfolio Standout Features and Integrations
Standout features include Create-a-Metric to track the most important data, metric and data warehouse capabilities to create a comprehensive repository, dashboards and reports with auto-refreshing functionality, and accessibility and security measures for better data integrity.
Integrations include Facebook, Google, HubSpot, Intercom, Jira, LinkedIn, QuickBooks, Slack, Shopify, and Twitter. You can upload data through pre-built connectors, REST API, spreadsheets, SQL database, or JSON files.
Pros and cons
Pros:
- Great customer support
- Lots of features for low pricing
- Easy setup
Cons:
- Limited data ingestion
- Sync rates are linked to pricing
datapine
Best for interactive dashboards that empower every person in your organization

This KPI analytics platform offers a powerful data-driven solution for companies who want to explore, analyze, visualize, and share company information from one central place. Their drag-and-drop interface ensures non-technical users are empowered to build dynamic business reports and gain valuable insights from complex data.
Why I picked datapine: I put datapine on this list because of their BI software, which covers six areas, including Analyze for visualizing data through 15 chart types, Connect for integrating common data sources, Reports for automated business analytics, Alarms for intelligent data alerts, Insights to understand business data, and Dashboards to build interactive business dashboards.
datapine Standout Features and Integrations
Standout features include embedded analytics for commercial software and public websites; custom dashboard templates by industry and function; different alert styles, like neural network and pattern recognition alerts; and SaaS BI tools accessible from mobile devices.
Integrations include DropBox Business, Google Analytics 360, Instagram, Meta for Business, Microsoft Azure, Microsoft Excel, OneDrive, Salesforce Sales Cloud, Twitter, and Zendesk Suite.
Pros and cons
Pros:
- Run and visualize advanced SQL queries
- Powerful forecasting and predictive analytics
- Versatile reporting formats
Cons:
- Limited statistical possibilities
- SQL tool is for technical users

This KPI software tool is designed to be a simple, hassle-free solution for building and sharing business dashboards full of real-time data. Their code-free design station allows anyone to build professional-looking dashboards and share them across the company to realign company values and engage employees by reminding them of goals.
Why I picked Geckoboard: One of the things I really like about Geckoboard is how easy it is to share a dashboard or report once it’s complete. They offer both a Send to Slack and Send to TV feature so managers have maximum sharing power that can be managed remotely.
Geckoboard Standout Features and Integrations
Standout features include dashboard examples and templates by department, sharing through TV and slack for remote updates throughout the entire team, ticketing system reports to help the customer support team identify pain points, and ecommerce dashboards for live monitoring in one place.
Integrations include GitHub, Google Analytics, Google Sheets, Mailchimp, Microsoft Excel, PayPal, Salesforce, Shopify, Slack, and Trello.
Pros and cons
Pros:
- Intuitive to design dashboards
- Quick setup and launch
- Very easy dashboard building
Cons:
- Limited analytics and BI
- Limited metric customization

This mobile-focused KPI tracking tool is designed to deliver data and insights to your team that are simple to review and understand. You can collect data from Excel or Sheets, your POS system, or even manually to get personal, team, and business KPIs. You can track performance, monitor reporting, and re-engage with your team using HandyKPI.
Why I picked HandyKPI: I wanted HandyKPI on this list because it’s one of the simpler KPI tracking tools to learn and use. It’s also one of the only mobile-focused options that’s actually designed to send to your team, whether they’re in a warehouse or at a brick and mortar store.
HandyKPI Standout Features and Integrations
Standout features include building and controlling dashboards from a mobile app, collecting and delivering KPIs to your team in minutes, celebrating and recognizing achievements for better employee engagement, and access to daily, monthly, or yearly dynamics on one screen.
Integrations include Google Sheets, Microsoft Excel, and API integration code.
Pros and cons
Pros:
- Low-cost pricing
- Mobile-friendly approach
- Simple KPI tracking
Cons:
- Limited forecasting tools
- No BI or analytics

As a comprehensive strategy, planning, and execution software, KPI Fire focuses on overall project management with KPI dashboards, goal setting and tracking, idea collaboration, and task management. Designed to help companies better align their teams, KPI Fire provides the tools you need to fulfill short-term and long-term objectives.
Why I picked KPI Fire: I put KPI Fire on this list because it’s such a comprehensive tool. With their KPI tracking, you can create dashboards for daily, weekly, monthly, and quarterly business reviews that show your progress for more accountability, recognition, and team alignment.
KPI Fire Standout Features and Integrations
Standout features include KPI management with multiple data input options, collaboration and communication tools, idea funnels to capture more ideas for improvement, a workflow library to streamline your operations, and a visual management system for better project monitoring.
Integrations include API Keys for integration with nearly any application.
Pros and cons
Pros:
- No technical experience necessary
- Intuitive navigation
- Very easy to use
Cons:
- Can take up to four months to implement for large companies
- Limited charts for metrics dashboards

Target Dashboard is a data visualization KPI software that’s designed to enhance the manager and team dynamic by connecting and mixing all company information in one place. The online dashboards are accessible and combine targets and actuals to automatically highlight areas of opportunity and concern for informed decisions.
Why I picked Target Dashboard: I chose this software platform because they prioritize connecting with any data source to get your information into their system. Whether it’s an SQL database, CRM, or financial system, you can sync your data into Target Dashboard directly or through a third party.
Target Dashboard Standout Features and Integrations
Standout features include a cloud reporting application that delivers visualized data to dashboards and reports, Business Intelligence that automatically tracks trends and offers multi-level drill-downs, and automated summary emails and notifications directly to your inbox.
Integrations include DropBox, Google Analytics, Microsoft Dynamics, Microsoft Excel, Microsoft SQL Server, Oracle, OrderWise, Sage, and SAP. Connect to any third party through the DataGrabber app.
Pros and cons
Pros:
- Cloud and online options
- Easy to learn
- Great customer service
Cons:
- No free trial
- No mobile app

Dasheroo is a dashboard-building, performance-tracking tool that has merged with a customer interaction platform called FreshLime and partnered with Databox for more accessible, intuitive KPI tracking and business management.
Why I picked Dasheroo: I chose to put Dasheroo on this list because the platform collaborates with two other powerhouses to deliver the results you want. With access to unique analytics features through Databox, a full suite of dashboard tools through Dasheroo, and convenient customer contact through FreshLime, you now control a multi-faceted sales tool.
Dasheroo Standout Features and Integrations
Standout features include team collaboration tools for real-time chat and commenting, metric alerts with notifications for selected metric changes, insight mashups for correlation and causation insights, and dashboard sharing through PDF and PNG.
Integrations include ActiveCampaign, Constant Contact, Google Analytics, Eventbrite, HubSpot CRM, LinkedIn for Business, Mailchimp, Meta for Business, SurveyMonkey, and Twitter.
Pros and cons
Pros:
- Reasonable pricing
- Easy and fun to use
- Three tools in one
Cons:
- May over-simplify tracking
- Limited analytics

Instead of a single KPI solution, Scoro offers a comprehensive work management platform for agencies, consultancies, and professional service organizations. Their product includes tools for project management and collaboration, time management, team utilization, and customer relationship management, as well as KPI tracking on a real-time business dashboard.
Why I picked Scoro: I chose Scoro for its reporting and analytics solutions, which provide actionable insights based on performance monitoring, structured data, and dynamic displays. You can monitor risk areas and create high-level reports with just a click and identify opportunities and bottlenecks for better decisions.
Scoro Standout Features and Integrations
Standout features include customizable dashboards that integrate summaries of work reports, financial reports, pipeline reports, and utilization reports; multi-account reporting features; interactive data sets viewable as charts, graphs, or spreadsheets; and dynamic report sharing based on permissions.
Integrations include Asana, Basecamp, DropBox, Evernote, GitHub, Harvest, Jira, Salesforce, Stripe, and Zapier. Scoro offers over 1,000 integrations.
Pros and cons
Pros:
- Intuitive learning and navigation
- Great customer support team
- Comprehensive work management app
Cons:
- Slight learning curve
- Clunky search functionality

InfoCaptor is a dashboard and KPI reporting software with three unique products, including the dashboard designer for desktop, an on-premise dashboard server service, and a WooCommerce focused reporting dashboard to track sales KPI, customer satisfaction, order metrics, tax reports, and product metrics.
Why I picked InfoCaptor: I chose InfoCaptor because of its focus on WooCommerce, which offers several different report types, including sales overview, sales by country, sales heat maps, and product sale trends, without any required setup.
InfoCaptor Standout Features and Integrations
Standout features include BI dashboard with access to various data sources, SQL dashboard that allows you to interact with your data, on-premise and cloud dashboard reporting options, WooCommerce reporting and BI plug-in.
Integrations include MySQL, PostgreSQL, Oracle, SQL server, SQLite3, and other JDBC and ODBC-compliant systems.
Pros and cons
Pros:
- Gamification elements in dashboards
- Limitless dashboard visualization options
- Extensive onboarding and training
Cons:
- No budgeting or forecasting features
- Each tool is priced separately
SimpleKPI
Best KPI-driven platform with solutions for all team sizes, departments, and industries

Unlike some of the other software options on this list, SimpleKPI is a focused data analysis solution that provides KPI creation, management, and monitoring. With dashboards, reports, and data analytics in one place, you can more easily track your company’s performance and realign strategic goals.
Why I picked SimpleKPI: I chose this software because one of its features targets analyzing underlying trends that may provide the root cause of swings and changes. You’ll get fast and detailed query results, drill-down features for data at all levels, data views from a wealth perspective, and report sharing through PDFs and Excel.
SimpleKPI Standout Features and Integrations
Standout features include dynamic KPI dashboard tools to provide detailed overviews of simple charts, various dashboard styles that range from sales and SaaS to marketing and manufacturing, access to a KPI library and templates to build your ideal reports, and collaboration tools to communicate with colleagues.
Integrations include API, spreadsheets, and connectors to share data with SimpleKPI. Zapier allows you to connect with over 5,000 apps, including 123FormBuilder, Clio, Cognito Forms, Facebook Lead Ads, Google Sheets, HubSpot, Knack, Microsoft Excel, and Outfield.
Pros and cons
Pros:
- Focus on aesthetics
- Quick to learn
- Easy to implement
Cons:
- Single-use tool
- Limited branding capabilities
Other KPI Software
I know there’s a pretty big list of options above, but I couldn’t finish this list without a few honorable mentions. Check out the runners-up for a few other business intelligence tools that help track and monitor KPIs.


Related KPI Software Reviews
If you still haven't found what you're looking for here, check out these tools closely related to KPI software that we've tested and evaluated.
- CRM Software
- Sales Software
- Lead Management Software
- Business Intelligence Software
- Contract Management Software
- Revenue Management System
Selection Criteria For KPI Software
Selecting the right KPI software is an important decision that impacts how effectively an organization can track performance, make informed decisions, and achieve its strategic objectives. My approach to evaluating KPI software is grounded in comprehensive research and hands-on testing, ensuring that the selected tool not only meets but exceeds the specific needs and expectations of its users. Here's how I break down my selection criteria:
Core KPI Software Functionality: 25% of total weighting score
To be considered for inclusion on my list of the best KPI software, the solution had to support the ability to fulfill common use cases:
- Streamlining data aggregation and visualization from multiple sources.
- Providing real-time insights to enable quick decision-making.
- Facilitating goal alignment across different organizational levels.
- Enhancing collaboration with features that allow sharing and commenting on KPIs.
- Offering scalability to grow with the organization's needs.
Additional Standout Features: 25% of total weighting score
When assessing beyond the basics, I look for:
- Advanced predictive analytics capabilities that can provide forward-looking insights.
- Exceptional data integration features that allow for seamless aggregation of information across platforms.
- Customizable AI-driven alerts that notify stakeholders of critical changes or milestones.
- Robust scenario planning tools that aid in strategic decision-making.
- Superior data security features to protect sensitive information.
Usability: 10% of total weighting score
Usability is paramount, and I evaluate:
- Intuitive design that facilitates easy navigation and minimal learning curve.
- Flexible reporting options that cater to various user preferences and needs.
- Responsive design that ensures accessibility across all devices.
Onboarding: 10% of total weighting score
Effective onboarding is key to adoption and value realization:
- Comprehensive training resources that empower users to leverage the software fully.
- Interactive support tools like product tours or webinars that facilitate a deeper understanding of features.
- A proactive customer success team that assists with setup and customization.
Customer Support: 10% of total weighting score
Quality support underpins user satisfaction:
- Multiple channels of support (e.g., chat, email, phone) that cater to user preferences.
- Prompt and knowledgeable assistance for troubleshooting and guidance.
- Proactive engagement to gather feedback and ensure user needs are met.
Value For Money: 10% of total weighting score
Evaluating the ROI:
- Transparent pricing that aligns with the feature set and scalability offered.
- Differentiated plans that cater to various organizational sizes and needs.
- Demonstrable impact on operational efficiency and decision-making processes.
Customer Reviews: 10% of total weighting score
User feedback provides real-world insights:
- Analysis of reviews across platforms to identify common strengths and weaknesses.
- Consideration of user testimonials on how the software impacts their KPI management and decision-making.
- Evaluation of the software's evolution in response to user feedback and market demands.
In selecting KPI software, it's imperative to choose a solution that not only ticks off essential functionality but also aligns with the organization's specific use cases and operational context. The goal is to empower users with actionable insights, foster a data-driven culture, and ultimately drive organizational success.
Trends In KPI Software For 2024
KPI software has continued to evolve, reflecting broader trends in business intelligence, data analytics, and revenue operations management. The integration of advanced technologies and methodologies has become pivotal, enabling organizations to harness more sophisticated, actionable insights from their KPIs. Below are the key trends shaping the KPI software industry, each addressing specific operational needs and challenges faced by businesses today.
Advanced Integration and Automation
- Seamless Data Integration: KPI software now offers more advanced integration capabilities, pulling data from an increasingly diverse array of sources, including IoT devices and external market data, to provide a holistic view of performance.
- Automated Data Processing: Enhanced automation features reduce manual data entry and processing, enabling real-time KPI updates and alerts that help businesses respond swiftly to changing conditions.
Predictive Analytics and AI
- Predictive Insights: The use of AI and machine learning to predict trends and provide foresight into potential future performance is becoming a standard feature, allowing companies to be proactive rather than reactive.
- AI-Driven Benchmarking: Novel AI capabilities enable benchmarking against industry standards and historical data, offering deeper insights into performance and competitive positioning.
User Experience and Accessibility
- Customizable Dashboards: User demand for highly customizable and interactive dashboards has led to significant advancements, allowing users to tailor their views and reports to meet specific needs.
- Mobile Accessibility: Enhanced mobile functionality ensures that stakeholders can access critical KPIs and reports anytime, anywhere, fostering greater agility and informed decision-making.
Declining Features
- Static Reporting: Static, non-interactive reports are becoming less popular as users demand more dynamic, interactive, and real-time KPI tracking capabilities.
- Isolated Systems: Standalone KPI systems that do not integrate well with other business intelligence and operational platforms are seeing a decline in favor as the need for interconnected systems grows.
As organizations strive to navigate increasingly complex and volatile market landscapes, the demand for KPI software that offers comprehensive, actionable, and accessible intelligence continues to grow. These trends highlight the industry's shift toward more strategic, forward-looking approaches to performance management, emphasizing the role of KPI software as a critical tool in driving business success.
What Is KPI Software?
KPI software is a tool used by organizations to track, analyze, and report on key performance indicators (KPIs). It aggregates and processes data related to various business metrics, presenting it in an accessible and actionable format. The software typically features customizable dashboards, data visualization tools, real-time tracking, and automated reporting, all focused on measuring and improving business performance.
The benefits of KPI software include enhanced ability to measure and monitor business performance accurately. It provides valuable insights for informed decision-making, helping organizations align their activities with strategic goals. The software aids in identifying trends, setting performance benchmarks, and improving operational efficiency. With its real-time data tracking and analysis, businesses can quickly adapt strategies, communicate progress effectively, and drive continuous improvement across all departments.
Features Of KPI Software
Selecting the right KPI software is crucial for managing revenue operations effectively. The ideal software should not only align with your strategic goals but also enhance decision-making processes, providing clear, actionable insights. Here are the most important features to consider when choosing KPI software to optimize revenue operations:
- Real-Time Data Integration: Ensures the software can aggregate and synchronize data across various systems instantly. This feature is vital for maintaining an up-to-date view of revenue streams and identifying emerging trends or issues promptly.
- Customizable Dashboards: Allows users to tailor their data visualization and analysis environment to their specific needs. Custom dashboards are essential for focusing on the KPIs that matter most to revenue operations.
- Predictive Analytics: Employs advanced algorithms to forecast future performance based on historical data. Predictive insights are crucial for proactive revenue management and strategic planning.
- Alerts and Notifications: Automatically notifies users about significant changes or milestones. Timely alerts help revenue operations teams respond swiftly to potential issues or opportunities.
- Collaboration Tools: Facilitates sharing and discussion of KPIs among team members. Collaboration features are key to ensuring alignment and fostering collective action based on KPI insights.
- Mobile Access: Provides the ability to monitor and interact with KPIs on the go. Mobile access is increasingly important for dynamic and fast-paced revenue operations environments.
- Comprehensive Reporting: Offers a range of reporting tools to analyze and communicate key insights. Effective reporting is indispensable for tracking progress, supporting decisions, and demonstrating success.
- Data Security: Ensures that sensitive revenue data is protected with robust security measures. Security is a non-negotiable feature given the confidential nature of revenue-related information.
- Scalability: Can accommodate growth in data volume and complexity. A scalable KPI software adapts to your evolving business needs, providing long-term value.
- User Support and Training: Offers resources and assistance to maximize the software's value. Adequate support and training are essential for ensuring users can leverage the software's full capabilities.
Selecting KPI software with these features will empower your revenue operations team to monitor performance effectively, make informed decisions, and drive sustainable growth. The right tool should not only provide deep insights into current revenue performance but also equip your team with the foresight to anticipate and respond to future challenges and opportunities.
Benefits Of KPI Software
By leveraging the right KPI software, businesses can align their strategies more closely with their operational performance, driving growth and efficiency. Here are five primary benefits of KPI software for users and organizations:
- Data-Driven Decision Making: Enables companies to base strategic decisions on solid data. Access to real-time KPIs ensures that decisions are informed, timely, and aligned with the organization's goals, enhancing overall business performance.
- Enhanced Visibility into Operations: Offers a comprehensive view of the organization's operational health. By centralizing KPI tracking, stakeholders gain a unified perspective on performance across different departments or business units, promoting alignment and synergy.
- Improved Goal Alignment: Facilitates the alignment of individual, team, and organizational objectives. KPI software helps ensure that everyone is working towards the same goals, fostering cohesion and driving collective success.
- Increased Agility: Allows organizations to respond rapidly to market changes or internal performance shifts. By providing timely data, KPI software enables businesses to pivot quickly, addressing challenges or seizing opportunities as they arise.
- Performance Optimization: Identifies areas for improvement and tracks the impact of corrective actions. Continuous monitoring and analysis of KPIs guide organizations in refining their processes and strategies, ultimately boosting operational efficiency and revenue.
Costs & Pricing For KPI Software
Selecting the right KPI software is a strategic decision that can significantly impact the effectiveness of your organization's revenue operations management. Various pricing and plan options cater to different sizes and types of businesses, and understanding these can help you choose the solution that best fits your needs and budget. Here's an overview of typical plan options you might encounter:
Plan Comparison Table For KPI Software
| Plan Type | Average Price Range | Common Features Included |
|---|---|---|
| Basic | Free to $20/user/month | Essential KPI tracking, basic reporting, limited integrations |
| Professional | $20 to $50/user/month | Advanced analytics, increased integration options, additional user accounts |
| Enterprise | $50 to $150/user/month | Customizable dashboards, full integration capabilities, premium support |
| Free Option | $0 | Access to core features, limited data sources, basic support |
When considering KPI software, it's crucial to assess how well each plan aligns with your organization's specific requirements. Factors such as the number of users, the complexity of your KPIs, and the level of support and customization you need should guide your decision. Always aim for a solution that offers scalability and flexibility, ensuring that the software can grow and adapt alongside your business.
KPI Software Frequently Asked Questions
Looking for more answers about KPIs? Check out my FAQs for common questions.
How do you measure KPIs?
There are several types of KPIs that can help you track important metrics, including:
- Qualitative KPIs are about human feelings that you can’t quantify through numbers. These are opinions, customer experiences, and reviews.
- Quantitative KPIs are measurable facts, like percentages, statistics, and revenue numbers.
- Leading KPIs are used to measure performance in order to explore future trends and predict success or failure.
- Lagging KPIs are ideal for reviewing what happened in the past to use historical data for future predictions.
How do you create a KPI report?
Building a KPI report in your software should progress along a guided path. But in case you want to prepare yourself ahead of time, you should plan to follow these basic steps:
- Define your business goals
- Pick the indicators that best track those goals
- Choose and integrate your preferred data sources
- Explore various visualization charts and styles for data at a glance
What are the types of KPI software?
KPI (Key Performance Indicator) software comes in various types to cater to different organizational needs, helping companies monitor, analyze, and improve their performance across various functions. Here are the main types of KPI software:
- Business Intelligence (BI) KPI Software: Integrates with multiple data sources to provide a comprehensive view of an organization’s performance. It offers in-depth analytics, data visualization, and reporting capabilities to help businesses understand their performance against strategic goals.
- Dashboard KPI Software: Focuses on visualizing data through customizable dashboards, allowing users to monitor their most important KPIs at a glance. It typically offers real-time data updates and interactive features to drill down into specific metrics.
- Performance Management KPI Software: Aligns individual performance with organizational goals, enabling companies to track employee performance against key metrics. It often includes features for setting targets, reviewing progress, and providing feedback.
- Financial KPI Software: Tailored for tracking and analyzing financial metrics, this software helps businesses monitor revenue, profits, expenses, and other financial indicators to make informed financial decisions and strategies.
- Marketing KPI Software: Designed to track marketing campaign performance, this type of software helps marketers monitor metrics like conversion rates, leads generated, ROI, and customer engagement to optimize marketing strategies.
- Sales KPI Software: Assists sales teams in tracking sales performance metrics, including lead conversion rates, sales volume, revenue, and customer acquisition costs, helping to optimize sales processes and strategies.
- Operational KPI Software: Focuses on monitoring and improving operational efficiency by tracking metrics such as production rates, downtime, and resource utilization, essential for manufacturing or service-oriented businesses.
- Industry-Specific KPI Software: Tailored to the unique needs of specific industries (e.g., healthcare, manufacturing, retail), these tools come with predefined KPIs relevant to the particular sector, facilitating more accurate and relevant performance tracking.
By understanding the different types of KPI software available, organizations can choose a solution that best fits their specific needs, ensuring they can effectively track and analyze the performance indicators most relevant to their success.
Can KPI software forecast future performance trends?
Yes, KPI software can utilize historical data analysis and predictive analytics features to forecast future performance trends, helping organizations plan strategies and make informed decisions based on projected metrics and trends.
Is there a real-time alert system for KPI deviations?
Many KPI software solutions include real-time alert systems that notify users when there are significant deviations from set thresholds or expectations, enabling immediate response to potential issues or opportunities.
Can KPI software integrate with multiple data sources?
KPI software often supports integration with a variety of data sources, including CRM systems, financial software, and operational systems, ensuring that users have a comprehensive view of performance across all relevant business functions.
Additional Revenue Operations Software
KPI software may not be the only digital tool you need to round out your tech stack. Check out a few of our other recommended revops tools below:
- Sales Acceleration Software
- Lead Retrieval Software
- Proposal Management Software
- Nonprofit CRM Software
- EPM Software
- iPaaS Software
Conclusion
KPI software could be the final piece of your tech stack to track organization success, learn about your weak spots, and predict your actions for the future. Hopefully, this list provided you with some options that meet your needs. But, if you’re looking for additional insights from the experts, sign up for our newsletter for weekly articles to guide your business decisions.