The Key Benefits Of Using A Business Intelligence (BI) System


Imagine you had two million rows of data from various sources and you had to answer these questions fast;
- What marketing campaigns drive more awareness vs. engagements?
- What partnerships would contribute more to revenue growth?
- Should revenue forecast and budget be refined?
- What’s our sales forecast for the next quarter?
My guess is that after a while, your eyes shut, data gaps frustrate you, you second guess your career path, and your brain is fried. That's the life of RevOps executives without Business Intelligence (BI) systems.
Think of a BI system as a clever assistant that helps you make better business decisions fast. They’re capable of ingesting raw data from different sources, transforming this data, and representing it visually through various forms.
And this isn’t their only advantage. In this article, we’ll explore even more benefits.
What Is Business Intelligence (BI)?
Business Intelligence is the process of gathering and using relevant, accurate data and empirical evidence to make business decisions.
The process involves ingesting relevant data from their sources, transforming, cleaning, and processing this data, and visualizing it for analysis.
BI also includes performing experiments to test hypotheses and segmenting users for tailored analysis.
Why Is Business Intelligence Important?
Remember the questions you had to answer at the beginning?
Business Intelligence is important because it helps you manage the end-to-end process of answering these questions and using the answers to make data-informed decisions.
BI manages and speeds up the process of data analysis in four steps:
- Data collection: BI systems have connectors for ingesting and migrating data from different data sources like APIs, CPQs, CRMs, data storage platforms, etc.
- Data mining and processing: Business intelligence software provides the environments to write SQL queries, and Python and R scripts to clean and transform your data for analysis. You can also use the drag-and-drop features to help you clean, process, and prepare data without code.
- Data analysis and visualization: BI tools use various formats of visualizations, such as maps, tables, charts, and graphs to understand your data, analyze it, and clearly communicate your discoveries to decision-makers.
Also, BI tools use artificial intelligence (AI) to automate analysis and tasks. For example, you could ask a BI tool in plain English "Show me all the sales from last quarter" and it would return a visualization of that data—making it easy for you to see trends and patterns. - Data storage: Some BI tools like Power BI have in-built data warehouses for data storage.
The Three Major Benefits Of Using A Business Intelligence System
When you search online for ‘The benefits of Business Intelligence(systems),’ search engine results barf advantages like ‘increased revenue, improved CX, and accurate reporting‘—and they’re not wrong.
However, these advantages are born out of three key benefits of business intelligence systems: Breaking down silos, improved data-driven decision-making, and enhanced productivity.

1. Breaking Down Silos
At B2B SaaS companies it’s pretty normal for the product, sales, marketing, finance, and even customer success teams to work as separate units.
The people, their processes, and their tools can be so focused on their individual KPIs and goals that they rarely collaborate or see eye to eye.
BI systems can serve as an instrument in breaking down these silos. It equips you with the ability to ingest data from different departmental systems into one system. Then employees from these departments can see how their data aggregates to tell the full customer story and improve operational efficiencies.
Adam Greco, Product Evangelist at Amplitude puts this advantage into perspective. He says, “10 years ago, I worked with Salesforce and after prospects signed up, I was shut out. Imagine a world where I find people from different keywords, I could inform the product team and say “Let’s push the CRM feature of Salesforce for X and Y users during their free trials because that’s what drove them to us.”
He continues:
“It would be really cool if I see what features the leads are engaged in and correlate it back to how I found that user. It would maximize my advertising efforts and discover what to advertise on different channels… ”
2. Improved Data-Driven Decision-Making
Before BI software, we used social media metrics, sales, product, and marketing analytics to measure the performance of our go-to-market efforts. So we’ve always made data-driven decisions.
The drawback was that system silos made attribution difficult. Was it sales or marketing that influenced buying? How does the lead behave after conversion, and how can we use that to inform our go-to-market strategies?
These were questions that, at the time, we could only dream of answering.
But as BI tools have helped to improve data quality, the quality of the insights we derive from them have also improved. And in turn, the decisions and actions we take. Note that the volume of data companies collect has also increased—big data—so it’s important to ingest only the data you need to avoid getting too overwhelmed and confused.
Thankfully, business intelligence solutions have visualization tools like charts, maps, and dashboards, so you can view and understand the data you need to make strategic decisions, faster. They also often provide automation opportunities, to spare you some of the hassle. Here are a few examples of ways you can make better data-driven decisions from BI:
- Recognizing market trends: Using data from social platforms, online forums, industry reports, and several competitor landscapes, you can perform market gap analysis, identify missed opportunities, and understand current customer needs and trends. This gives a competitive advantage and helps to identify key players and trends in new markets.
- Sales forecasting and optimization: You can ingest sales data from field sales software, CRMs, sales engagement software, etc. to get forecast sales reports based on historical sales data. You can also enrich data from other systems like Amplitude to understand user behavior. Allowing you to make better sales goals and allocate resources better.
- Increase customer experience: Customers themselves want you to use their data if it means they’ll have a better experience with your brand. You can use customer data to identify frictions, personalize experiences, and improve customer satisfaction.
- Improved go-to-market and product strategies: Data from all these sources gives you insight into the efforts that work and the ones that don’t — enabling you to make better go-to-market decisions.
When you make better insights from market trends, sales, customer experience, and product, you ultimately make better decisions. Your revenue flows and your processes evolve, your profit margins increase, you’re able to spot inefficiencies and you gain a competitive edge.
3. Enhanced Productivity
Business Intelligence platforms include standard features like:
- Ad Hoc reporting and analysis: You can request for reports and analysis on a dataset as needed. You also change and filter out the data you want on your report.
- Report and dashboard templates: templates that you can customize dashboard and visualization to fit your business needs.
- Drag and drop builders: This allows you to join data without an analyst or scientist. Also, create dashboards and visualizations faster
- AI and automation: Some BI systems allow you to schedule reporting, collect real-time data to automatically update dashboards and reports, and automate analysis.
- Connectors: Connectors allow you to ingest data from different without thinking of engineering cost and time-to-completion.
These features including data visualizations allow you to enhance productivity and analyze datasets in less time. It also minimizes human errors leading to faster and accurate reporting.
But don’t just take my word for it. Here are a couple examples of ways that BI solutions have helped B2B SaaS companies increase productivity:
- Klipfolio saves Irdeto 15 hours of marketing report work per month with KlipfolioM
- Zoho Analytics helps Whatsconvert identify bottlenecks faster using visualizations
How B2B SaaS Companies Are Taking Advantage Of BI
We explored how some SaaS companies used BI to increase productivity. Now we’ll see how some other B2B brands are enjoying the benefits of BI.
- Zoho Analytics helped Peri increase revenue by 25% - 30% and increase customer engagement by 50%.
- Tableau saved Splunk $300K/year in server and platform administration costs.
- Genesys uses MicroStrategy to unify their data and get a 360 view of the business. This has helped to increase user adoption and increase reach.
Adding The Benefits Of BI To Your Business
Throughout this article, I have shown that if done right, B2B SaaS brands can take advantage of BI to positively impact business and revenue outcomes. Here are some steps you can take to reap the advantages of BI in your company:
1. Identify your BI maturity level
This is a measurement that indicates your company’s current stage of BI adoption. You can ask yourself some variation of the following questions to form an idea of where you’re starting from, and where you want to get to.
- Are you BI unaware?
- Are you looking to take advantage of BI?
- Are you using standard features like reporting already?
- Are you advanced in analysis and building your own models?
- Are you a BI advocate – building tools on top of your system?
2. Plan your strategy
The next step is defining your reason for using BI, objectives, and identifying the resources required.
Ask yourself: Where could better data analytics improve retention, expansion, campaign ROI, pricing strategy optimization, forecast accuracy, and other outcomes?
Then, document specific scenarios where BI will deliver tangible value, and infrastructure cost with upgrades and expansion.
Set Specific, Measurable, Achievable, Relevant, and Time-bound (SMART) goals to understand what your end state should look like. For instance:
A SMART goal for a small B2B SaaS company (resource planning software) in the early stages of BI maturity could be to:
- Collect one year of data on customer behavior to understand customer experience in 1 month.
- Analyze data on customer behavior, such as website traffic, purchase history, and social media activity to understand how it affects customer satisfaction.
A SMART goal for a Fintech infrastructure SaaS company in its early stage of BI maturity could be to:
- Collect data from sales teams to identify new opportunities in sales.
- Identify customers who are at risk of churning
Measure the success of your strategy by:
- Tracking the number of data points collected and the number of reports generated.
- Looking at the impact of your results on your objectives.
3. Define your Key Performance Indicators
In step three, set KPIs to measure the success of your strategy. Your KPIs should align with your goals.
For example, since company X’s goal was to improve customer satisfaction, KPIs should include:
- Customer acquisition cost (CAC)
- Lifetime value of a customer (LTV)
- Customer satisfaction (CSAT) score
- Net promotor Score etc.
Company Z’s goal was to improve sales efforts, KPIs should look like this:
- Sales qualified lead (SQL) conversion rate
- Customer churn rate
- Mean Absolute Percentage Error (MAPE)
- Mean Absolute Deviation (MAD)
4. Set your budget
Once the roadmap is defined and KPIs are established, the next step is budgeting the resources required to execute the BI strategy or the cost of tools and infrastructure(self-hosted or managed, or cloud )
While BI requires considerable investment, the long-term payoff in data-driven decision-making can be well worth the price.
In setting a BI budget, below are some strategies to help you set a budget-friendly infrastructure;
- Starting small with a limited pilot project to validate ROI before enterprise-wide rollout
- Explore open-source BI tools to reduce software licensing costs and own every component (self-hosted)
- Training internal staff on basic BI tools before bringing in costly consultants
- Phase capabilities over time rather than implementing everything at once
- Applying for sponsorships and investments.
5. Select your BI tools
Before selecting your BI tools, first conduct an audit of your existing analytics infrastructure and overall data stack. Identify gaps that the new business intelligence software can fill, and evaluate capabilities around reporting, dashboards, data visualization, predictive modeling, and data preparation.
Let's say you decide to use an open-source BI tool (self-hosted). In this case, you need to evaluate the features and functions of the tool to see how they can help you achieve your objectives. You also need to design your BI stack based on the features and functions of the tool.
For example, can you only do reporting with the tool, or do you need to integrate any external tools or helper functions to achieve your BI strategy?
More Articles
- The 17 Best Account Management Books to Master Client Journeys
- What is Sales Forecasting? Your Key to Informed Decisions
- What is CPQ: A Guide to ‘Configure, Price, Quote’ for RevOps Teams
- 4 Benefits of Conversation Intelligence Software: How Can It Enhance Your Operations?
- 18 Business Intelligence Books You Can’t Miss
Here are some specific questions you should ask yourself when evaluating an open-source BI tool:
- What data sources can the tool connect to?
- What types of data analysis can the tool perform?
- What kind of visualizations can the tool generate?
- How easy is it to use the tool?
- Is the tool scalable?
- Is the tool supported by a community of users?
Prioritize enterprise-ready or self-hosted platforms that allow easy expansion from initial use cases. Balance ease of use with functionality based on your analytics design.
For core BI platforms, options include Tableau, Microsoft Power BI, Qlik, Looker, Sisense, and more.
6. Create your roadmap
Once you have defined your goals, KPIs, and budget, and selected your tool, you need to create a roadmap for implementing your BI strategy. A roadmap lays out how and when elements of your BI implementation will fall into place. It brings together all the key activities into an executable timeline.
With a well-defined roadmap in place, you can confidently roll out BI capabilities that align with your strategy and business goals. Adjust timeframes as needed based on resources and requirements.
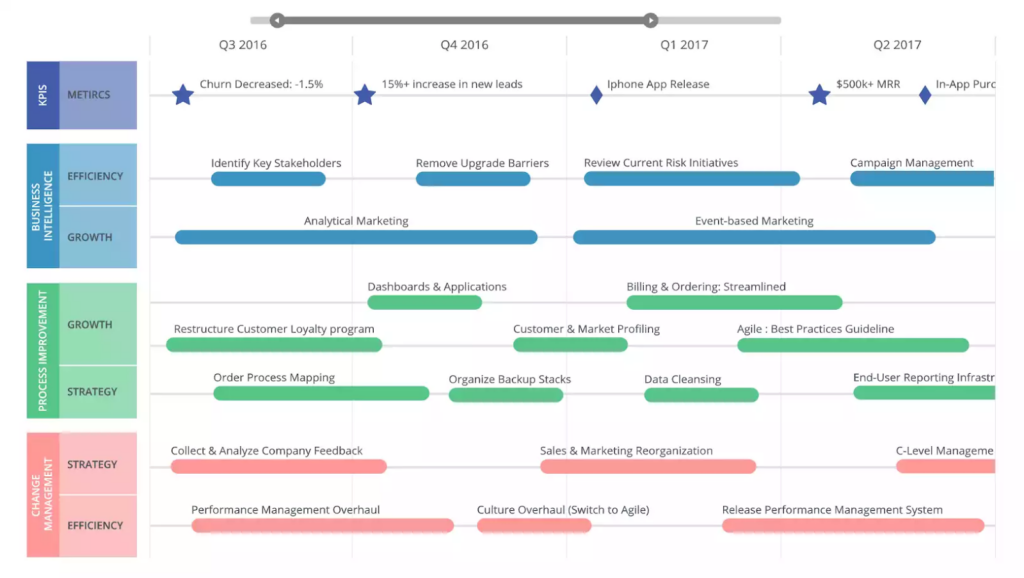
From the image above, we can deduce the roadmap that identifies the expected objective and the scope for each phase or quarter. Your roadmap may span several months or years depending on scope. It should outline both short-term quick wins and long-term objectives.
Launch A Pilot Project And Take Action
After creating a strategy, repairing your data, getting metrics, and creating a roadmap, you can finally launch a pilot project. Make sure you keep a close on your system to ensure everything is working fine, and constantly look for areas to optimize and improve.
It’s also important to always take action on the insights you get from BI systems. For instance, if you find that after performing a competitor analysis your pricing strategy creates friction, act on it. It may sound simple and obvious, but sometimes it still needs to be said. The data is intended to be analyzed, and then actioned.
To learn more about BI and other ways to improve revenue strategy, sign up for our RevOps Team newsletter. Join our community of intelligent business leaders like yourself who are passionate about RevOps, and get all the latest straight to your inbox.