10 Best Self-Service BI Tools Shortlist
Here's my pick of the 10 best software from the 20 tools reviewed.
With so many different self-service BI tools available, figuring out which is right for you is tough. You know you want to make data analysis more accessible and user-friendly for your whole team but need to figure out which tool is best. I've got you! In this post I'll help make your choice easy, sharing my personal experiences using dozens of different self-service BI software with various teams and data sets, with my picks of the best self-service BI tools.
What Are Self-Service BI Tools?
Self-service BI (Business Intelligence) tools are software applications that enable non-technical users to access, analyze, and visualize data independently, without needing specialized skills in data analytics. These tools offer a user-friendly interface, data visualization capabilities, and drag-and-drop functionalities for report creation and analysis. They integrate various data sources and provide real-time data access, allowing users across an organization to perform their own data analysis and reporting.
The benefits of self-service BI tools include empowering business users to conduct data analysis, which fosters a data-driven culture within the organization. They reduce reliance on IT departments for routine data queries and report generation, leading to faster and more efficient decision-making processes. By enhancing data literacy among employees, these tools improve overall understanding and use of data in business operations. Additionally, self-service BI tools facilitate collaboration through easy sharing of insights and reports, and they offer cost savings by streamlining traditional BI processes.
Overviews Of The 10 Best Self-Service BI Tools
Are you ready to learn more about why each of these self-service business intelligence tools made my list? Read each overview for a tool summary, a list of outstanding features, an overview of pricing and trial offers, and a few pros and cons that can help you narrow down your options.
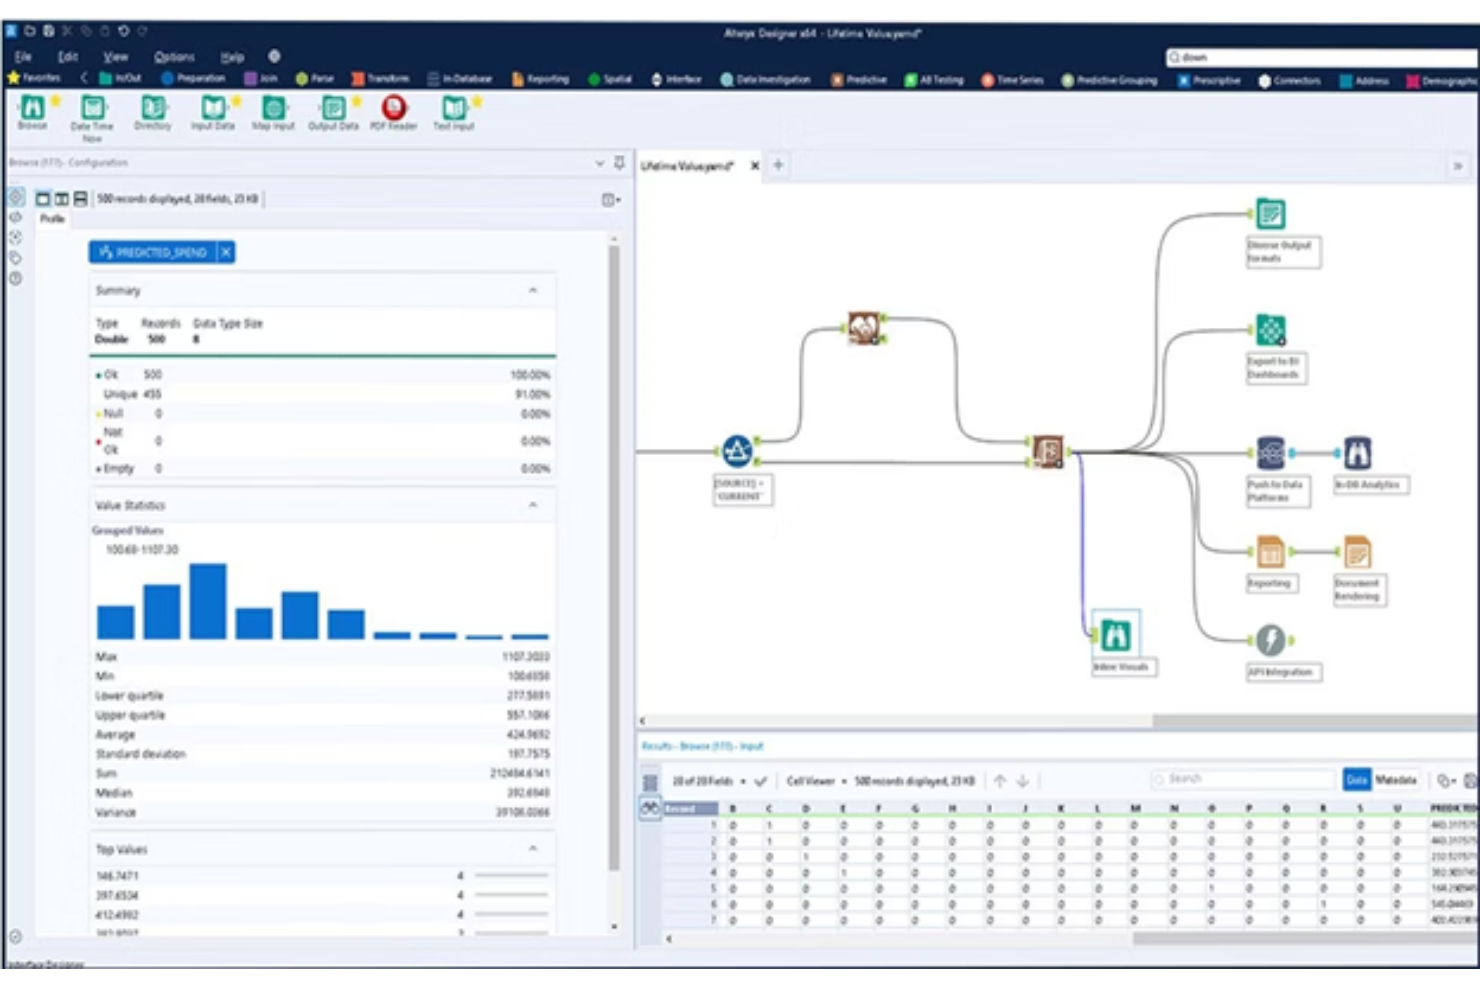
This cloud-based BI tool offers you the chance to automate every part of your analytics, from data prep to data science. Alteryx provides access to any data type or source, allowing you to blend all information through an intuitive drag-and-drop interface. This platform provides both no-code and low-code processes.
Why I picked Alteryx: What I really like about this platform is the focus on accelerating the time to value of BI tools by helping your team learn as much as possible about the program in the shortest amount of time. Whether it’s through built-in best practices, a learning program, or solutions shared by the Alteryx community, you have the tools to optimize implementation.
Alteryx Standout Features and Integrations
Standout features include automated machine learning with no coding required for non-technical users and data storytelling that explains insights in simple, clear language.
Integrations include Adobe Analytics, CARTO, DataRobot, Immuta, Microsoft Azure, Oracle, Syniti Matching, Tableau, UiPath, and Veritone Automate Studio.
Pros and cons
Pros:
- Academy and learning tools for new users
- Comprehensive feature list
- The interface is very easy to use
Cons:
- Platform is pretty high priced
- Can be slow with a bad internet connection
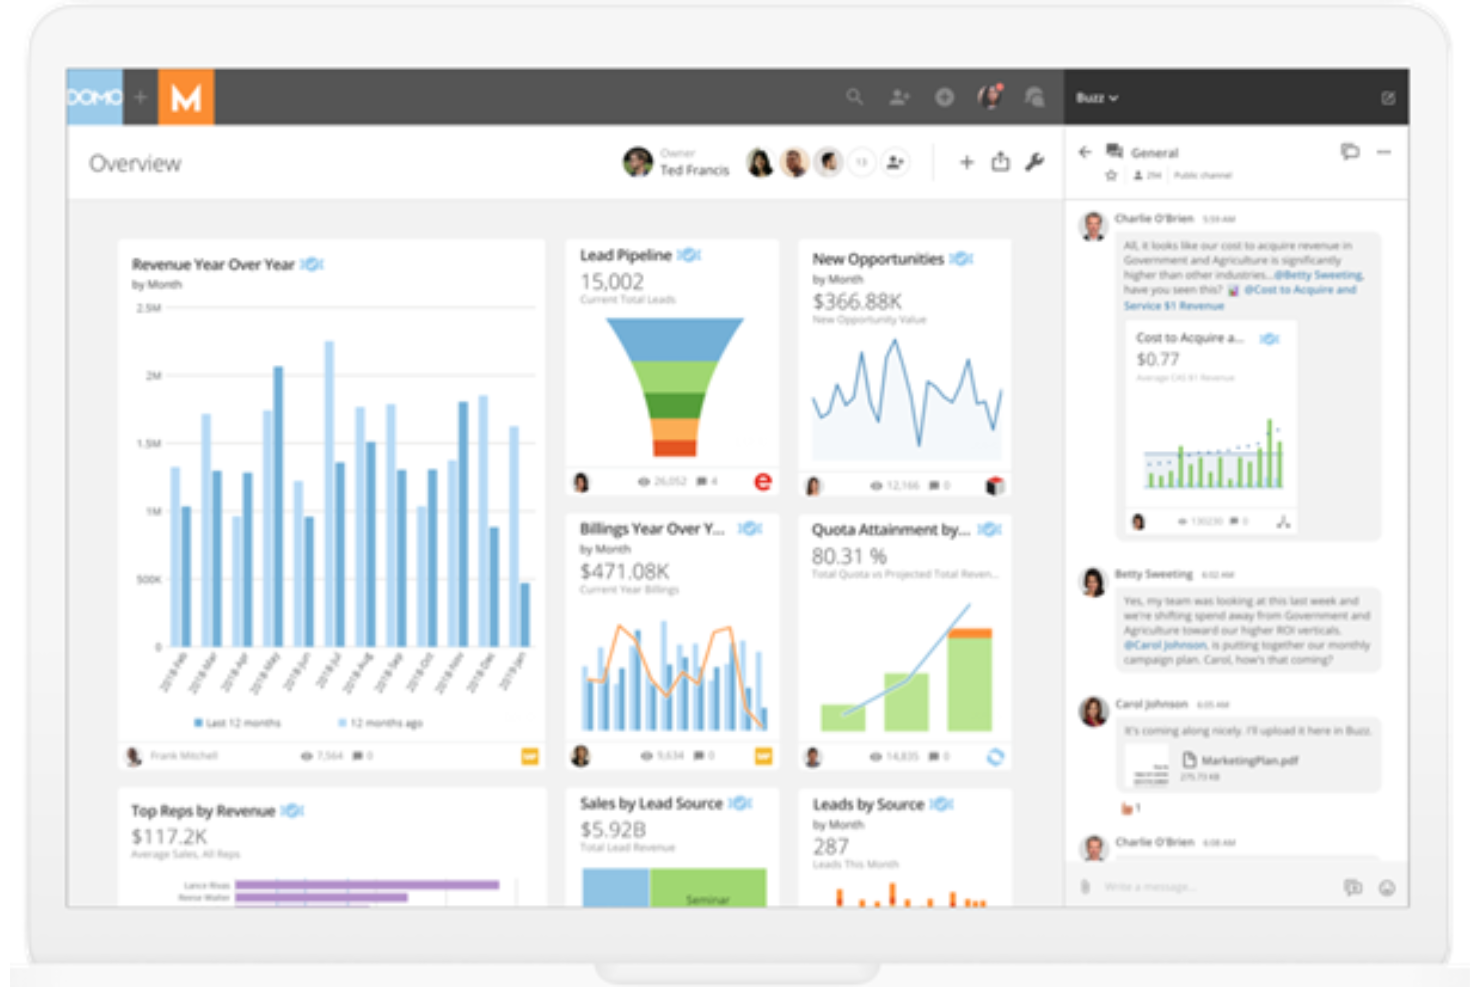
With its self-service reporting and analytics features, Domo can multiply the impact of analytics on your business by getting everyone involved with this cloud-native platform. It goes beyond traditional BI to make data more visible, actionable, and user-friendly through intuitive dashboards and apps, helping you optimize business processes at scale.
Why I picked Domo: While this should be an industry standard, this tool caught my eye because it prioritizes the shift from static data to real-time data with automated reporting that constantly gets fed a stream of fresh information to ensure accuracy no matter when or where you’re looking at your reporting.
Domo Standout Features and Integrations
Standout features include drag-and-drop ETL tools that make it easier to pull data from multiple sources and automated report scheduling to send updates to key stakeholders.
Integrations include Basecamp, DocuSign, Dropbox Business, GitHub, Google Analytics 365, Google Drive, Mailchimp, Microsoft Excel, SurveyMonkey, and Trello.
Pros and cons
Pros:
- Customizable user interface
- OOB connector is simple to use
- Easy to build visualizations
Cons:
- Non-technical customer support
- No ability to link data sets
Looker
Best for delivering trusted data experiences from the cloud of your choice
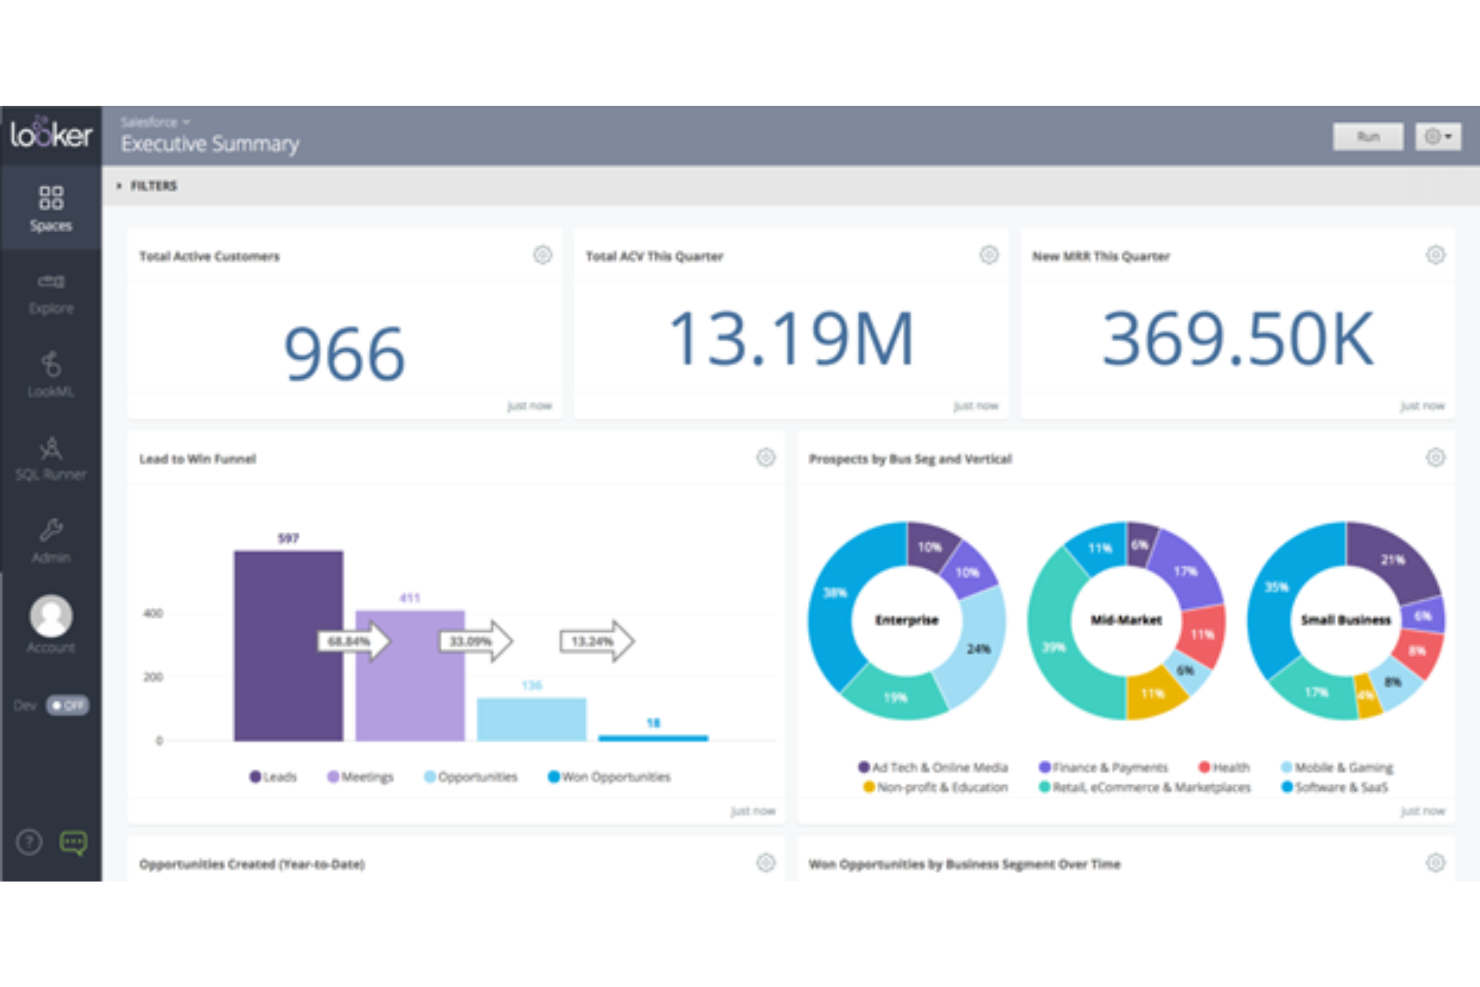
Now a part of Google Cloud, Looker is a BI platform that strives to ensure an intuitive approach of data exploration to end users. With the web-based interface, Looker enables you to build and share reports so that your organization can develop insight-powered workflows.
Why I picked Looker: This tool seemed to be particularly valuable for its close association with Google. The platform is built on Google Cloud infrastructure and is available as a service to integrate with any existing cloud portfolio in the Google Cloud console to ensure you have an accessible place to start and manage Looker instances.
Looker Standout Features and Integrations
Standout features include LookML that creates SQL queries on behalf of users and Looker Studio that connects you to a semantic model for analysis, exploration, and visualization.
Integrations include Asana, Dropbox Business, Google Analytics 360, Google Workspace, HubSpot, Mailchimp, Microsoft Excel, Rippling, Salesforce, and Slack.
Pros and cons
Pros:
- Free tools are available
- Intuitive navigation and learning process
- User-friendly design and interface
Cons:
- Mostly online support through forums and FAQs
- Delayed performance for large data sets
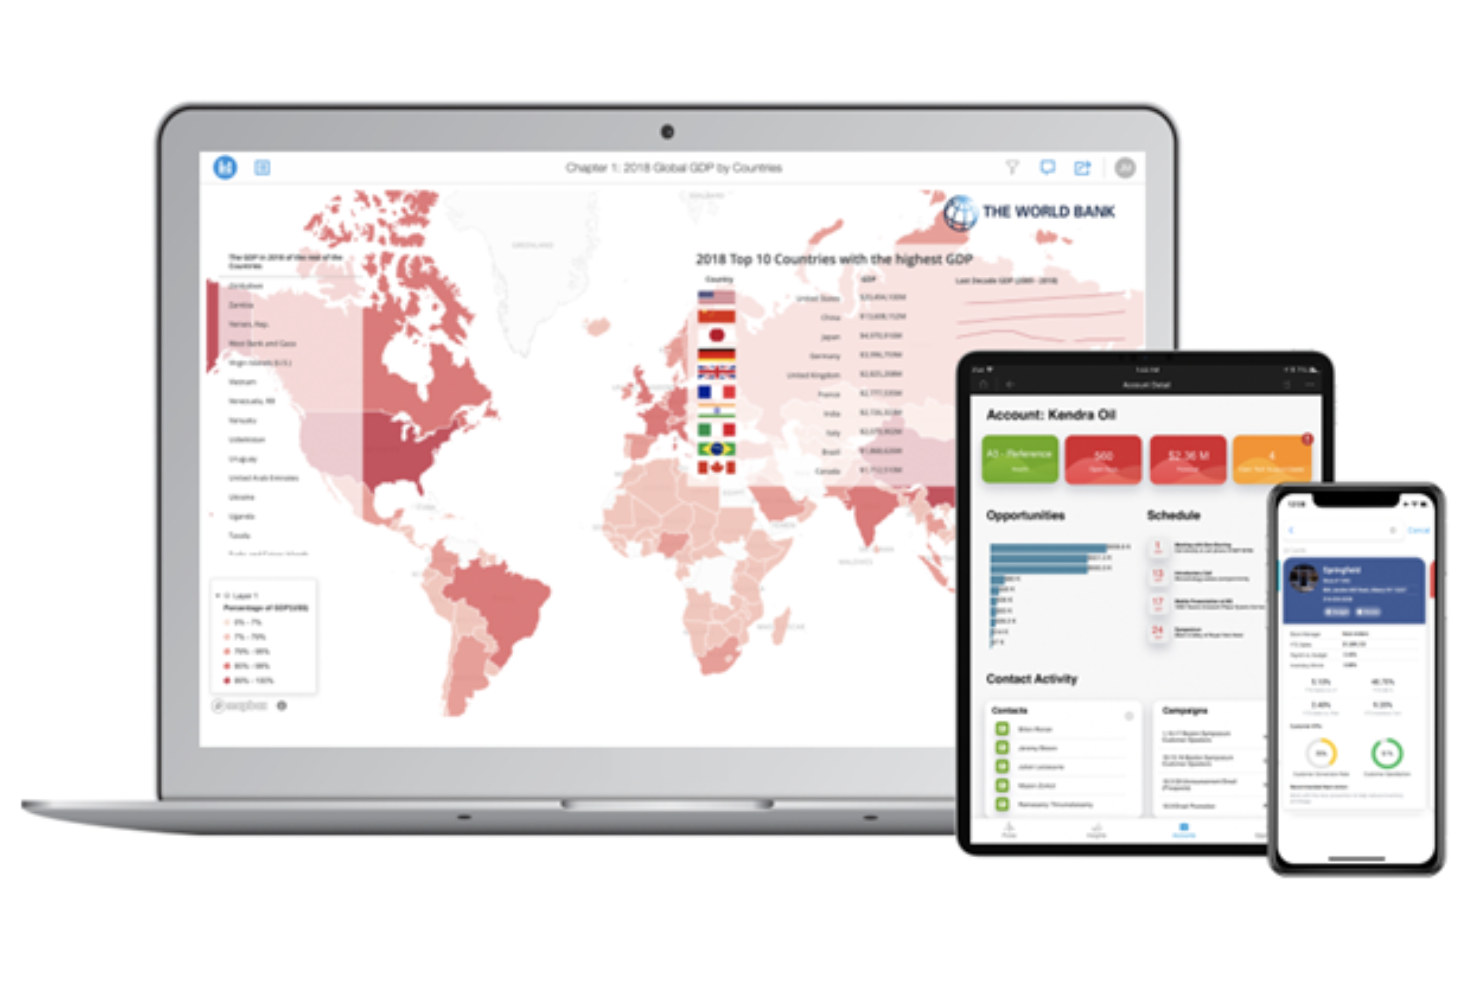
This self-service BI platform is built to ensure you can make faster business decisions with tools that help explore data and share insights in minutes. With intuitive visualizations, mobile accessibility, unlimited data sources, and drag-and-drop functionality, anyone in your organization can analyze and showcase relevant metrics with versatile reporting tools.
Why I picked MicroStrategy: I chose this platform because it offers an easier way to query your data. Instead of dealing with SQL complexity, MicroStrategy can automatically generate accurate SQL queries to answer business questions. This feature uses natural language processing to translate plain text into SQL for you.
MicroStrategy Standout Features and Integrations
Standout features include versatile data connectors that can ensure you have access to unlimited sources and AI-powered chatbot that can help explain the data they’re seeing to your team.
Integrations include Amazon Redshift, Cloudera, databricks, Google, Microsoft 365, Microsoft Excel, MongoDB, Salesforce, Snowflake, and Vibe.
Pros and cons
Pros:
- Flexible and robust BI tool
- Intuitive navigation and interface
- Easy to understand tools
Cons:
- Costs can be higher than average
- Older interface designed years ago
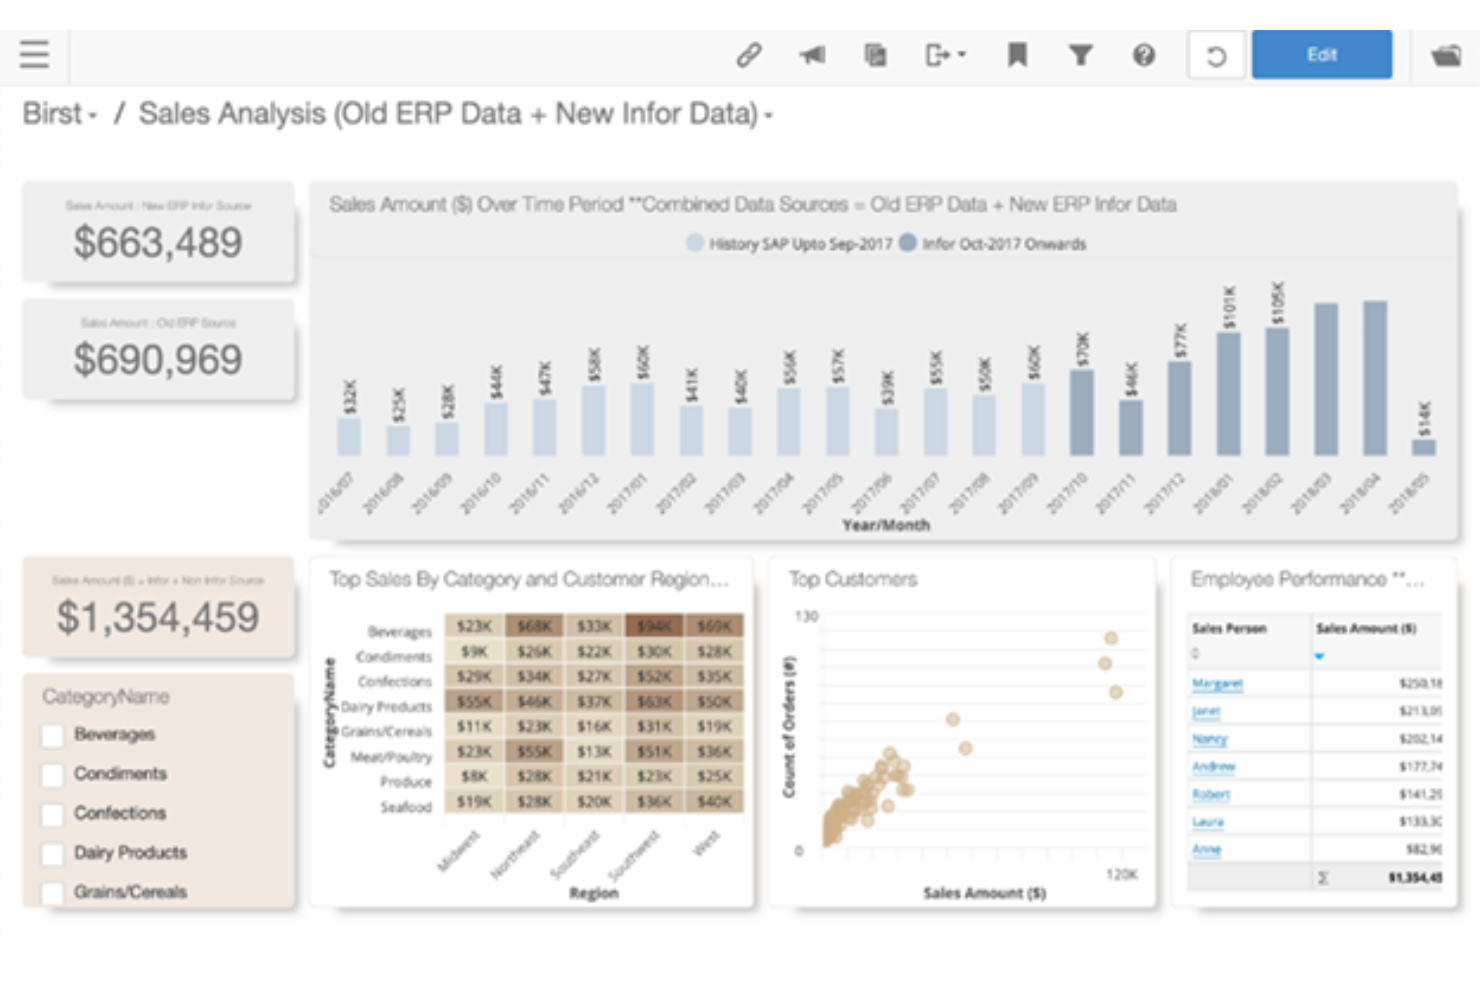
As a native cloud BI solution, Infor Birst offers you a platform to help you understand and optimize the most complex processes in your workflow. Their unique BI capabilities come together in Networked BI, which is a new approach to DaaS that’s based on enhancing speed and ease of use with data analytics.
Why I picked Networked BI: I chose this platform because it combines the best aspects of both centralized and decentralized BI models for more agile end-user self-service. Use and reuse common business rules and definitions, get analytics sandboxes with self-service data prep, and enjoy enterprise-grade governance that’s fast and flexible.
Networked BI Standout Features and Integrations
Standout features include modern data architecture for a flexible, business-centric approach to data management and industry analytics that provides role-specific data models.
Integrations include AvaTax by Avalara, Acumen Group Bid Prep, Broad Jump Pharma Pricer, CADTalk ERP, D3 Bubble Chart, Decision365, Dragon Grid, GTreasure, Prophecy IoT, and VisualK.
Pros and cons
Pros:
- Customizing measures and attributes is simple
- User-friendly report designing tools
- Has processing and infrastructure capabilities
Cons:
- UI design could still be improved
- Limited BQL functions
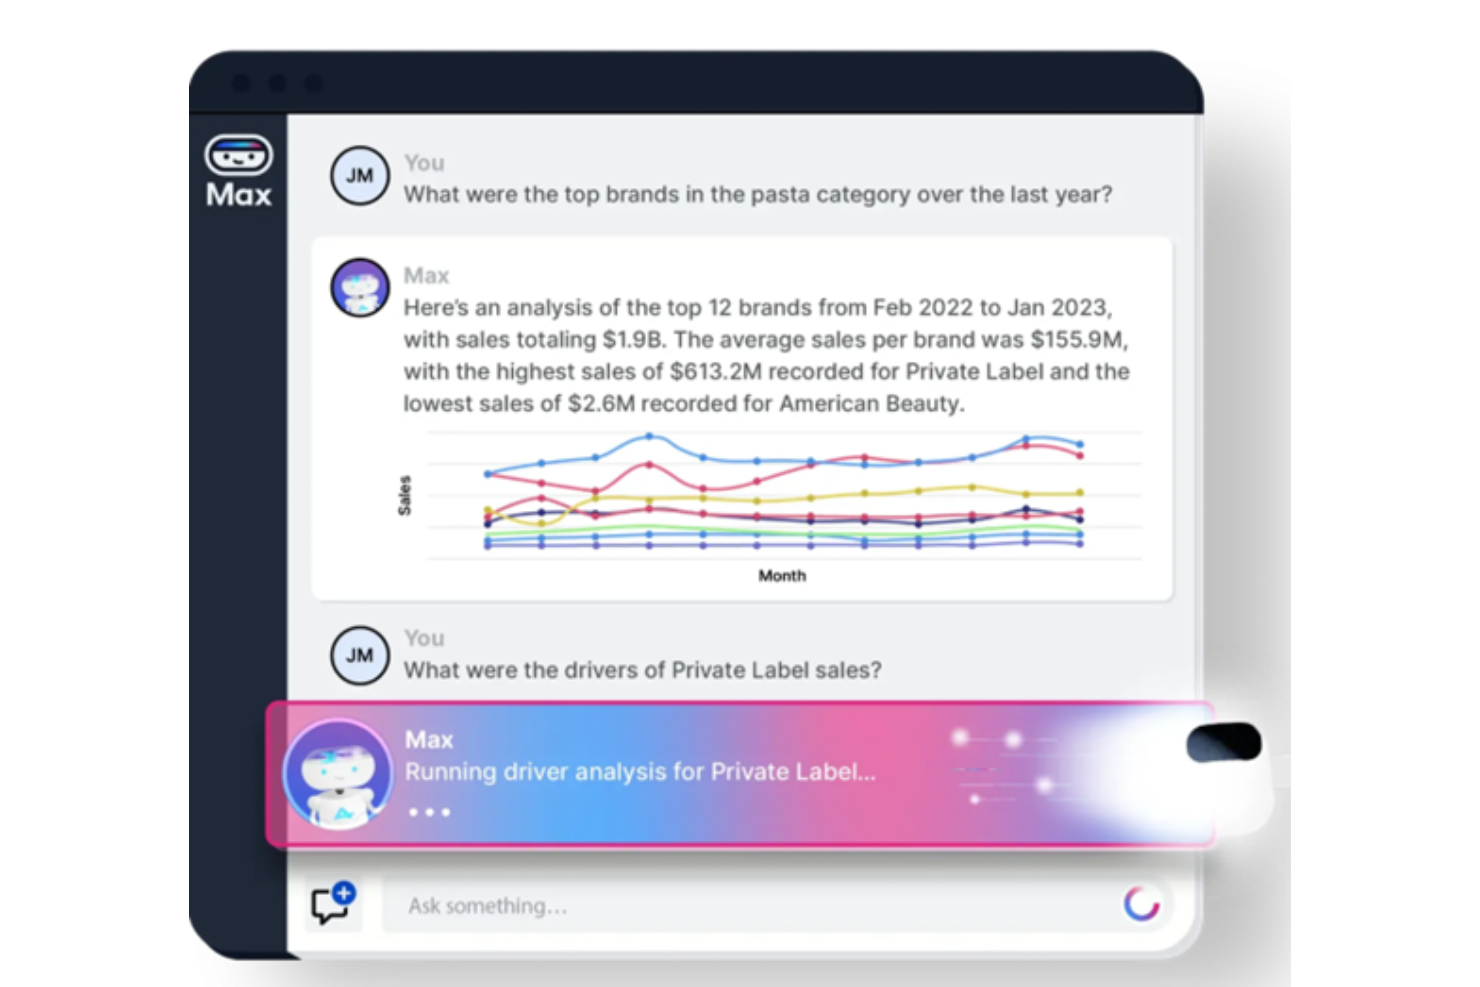
This web-based, AI-powered BI software is designed to prioritize self-service for data analysts, category managers, and market researchers through the use of artificial intelligence and machine learning techniques. These tools come from the proprietary RocketBots that scan and learn from your existing data to present you with new discoveries.
Why I picked AnswerRocket: I chose this platform for my list because of Max, AnswerRocket’s AI assistant. This tool has a built-in analytics toolkit that understands your business and data to turn raw information into insightful stories that can help you make faster, smarter business decisions. Chat with Max like you would a coworker, asking questions you need answers to.
AnswerRocket Standout Features and Integrations
Standout features include a natural language interface to explore data using plain English and purpose-built RocketBots that can help you automate analytics for common use cases.
Integrations include Apache Drill, Denodo, Google Analytics, Hive, MariaDB, Oracle, Salesforce, SAP Hana, Spark, and Teradata.
Pros and cons
Pros:
- Responsive customer support team
- Simple to navigate the tools
- Answers are always easy to understand
Cons:
- Import features could be improved
- Not the most intuitive for beginners
Best for supporting developers with direct access to the Qlik Associative Engine
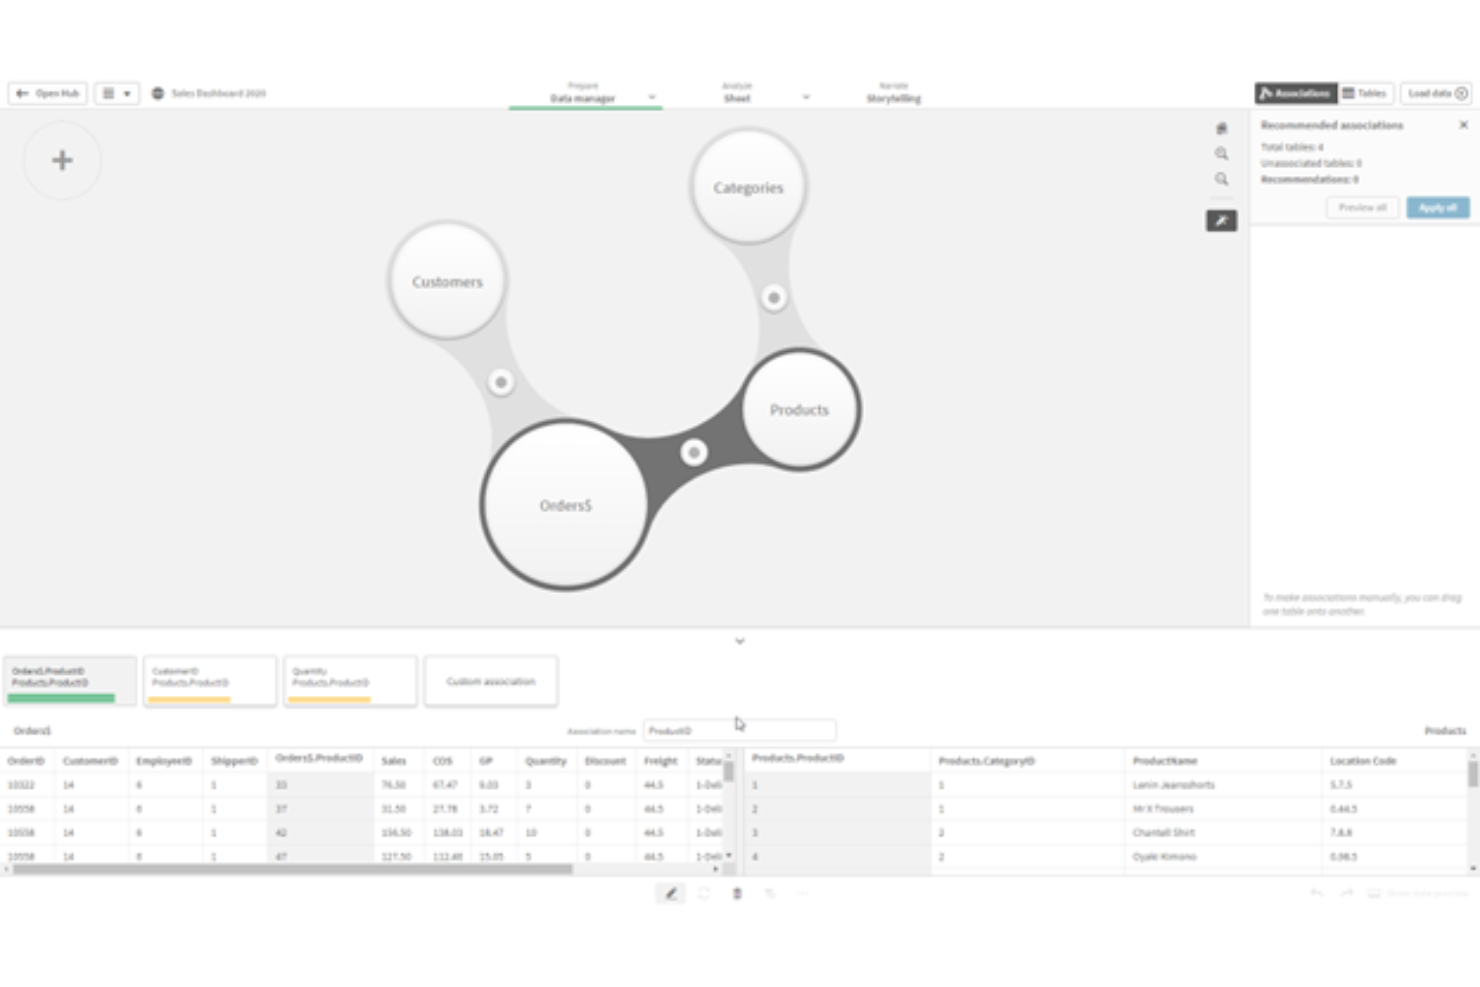
The Qlik Analytics Platform is designed to accommodate your need for embedding analytics to extend the power of Qlik Sense throughout your enterprise. You can directly access the market-leading associative in-memory engine available in all Qlik products to get more flexibility to build the solutions you need.
Why I picked Qlik Analytics Platform: One reason this tool made my list is because of the way the APIs were built to work with today’s most modern web technologies. Your developers can access open, standard, and modern interfaces, including HTML5, CSS3, and Node.js to create visual analytics and integrate them into any application.
Qlik Analytics Platform Standout Features and Integrations
Standout features include no-code automation available at higher payment tiers and mobile-ready Big Data visualization capabilities.
Integrations include CARTO, CCH Tagetik, Falcony, MongoDB, Newbook, RowShare, Smartsheet, Snowflake, SysAid, and TOPdesk.
Pros and cons
Pros:
- Helpful and supportive online community
- Simple to get started
- Easy to use as an admin and end user
Cons:
- Data integration is affected by connectivity strength
- Higher tiered plans are expensive
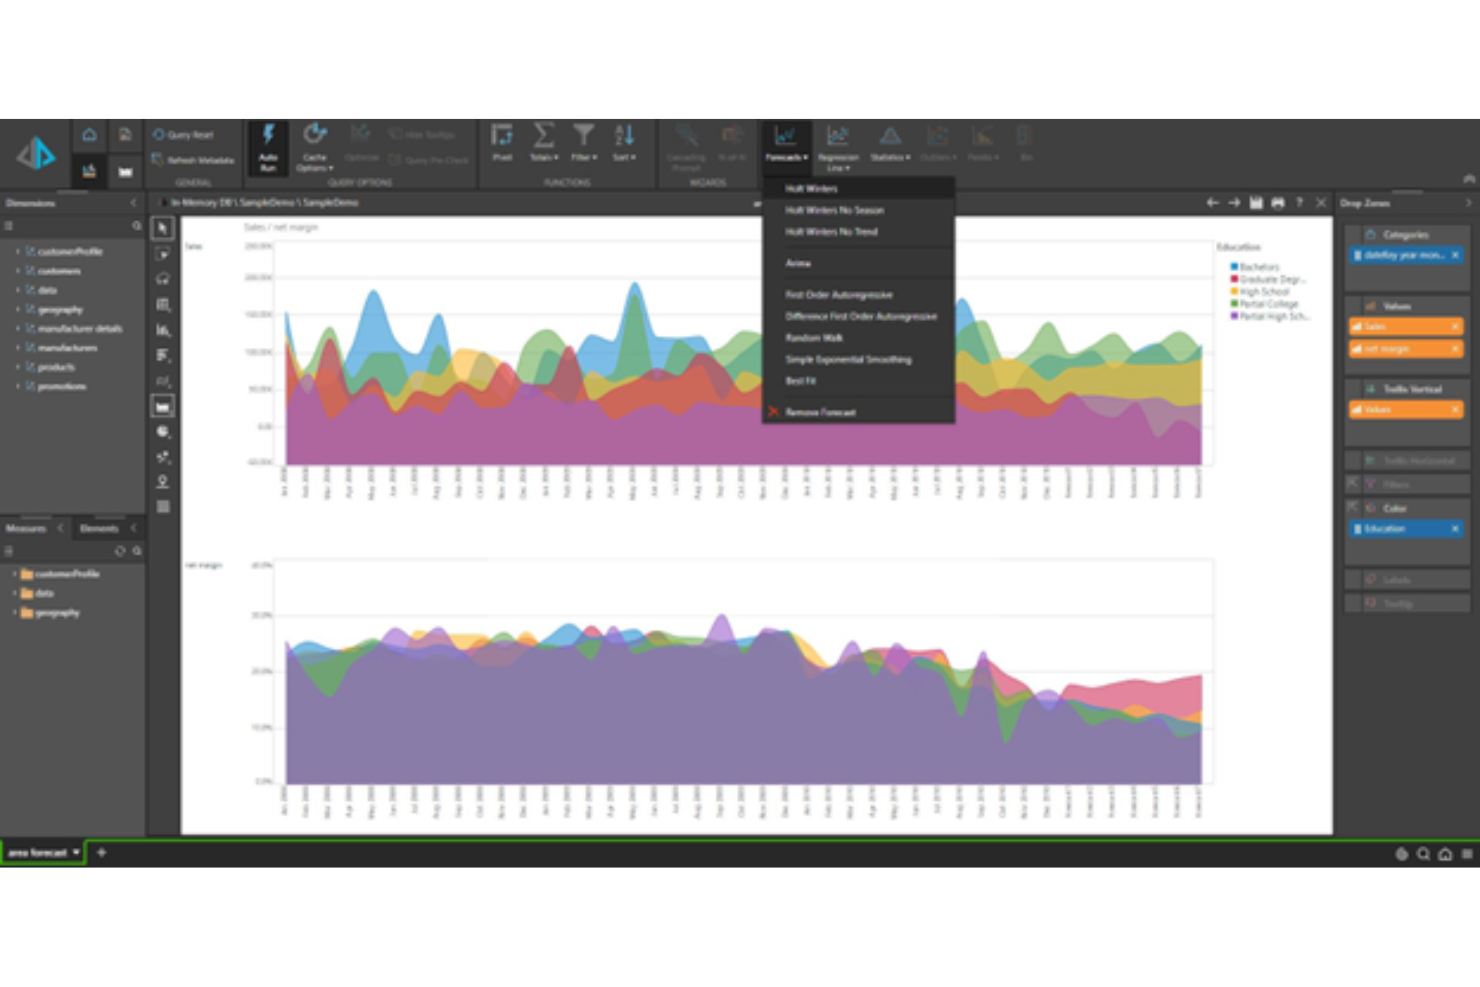
Pyramid Analytics, also known as the Pyramid Decision Intelligence Platform, is designed for businesses and individuals to use and scale AI-powered solutions that transform complex data into actionable insights without the need to code. This business data app is ideal for IOT applications and data visualization at an enterprise scale.
Why I picked Pyramid Analtyics: One feature that caught my eye on this platform is the interactive analysis builder. With this tool, you can access six modules to analyze and visualize your data, including point-and-click graphical interface and slice, dice, and drill down for data discoveries.
Pyramid Analytics Standout Features and Integrations
Standout features include out-of-the-box machine learning libraries, R, and Python for training and testing, as well as PYRANA direct query engine for fast performance using any data source.
Integrations include AWS, Azure Synapse Data, CData, Datavard, Exasol, Google BigQuery, Kubernetes, SAP, and Snowflake.
Pros and cons
Pros:
- Experienced customer service representatives
- Simple to set up and implement
- A very easy tool to use
Cons:
- No mobile app accessibility
- Limited integration options
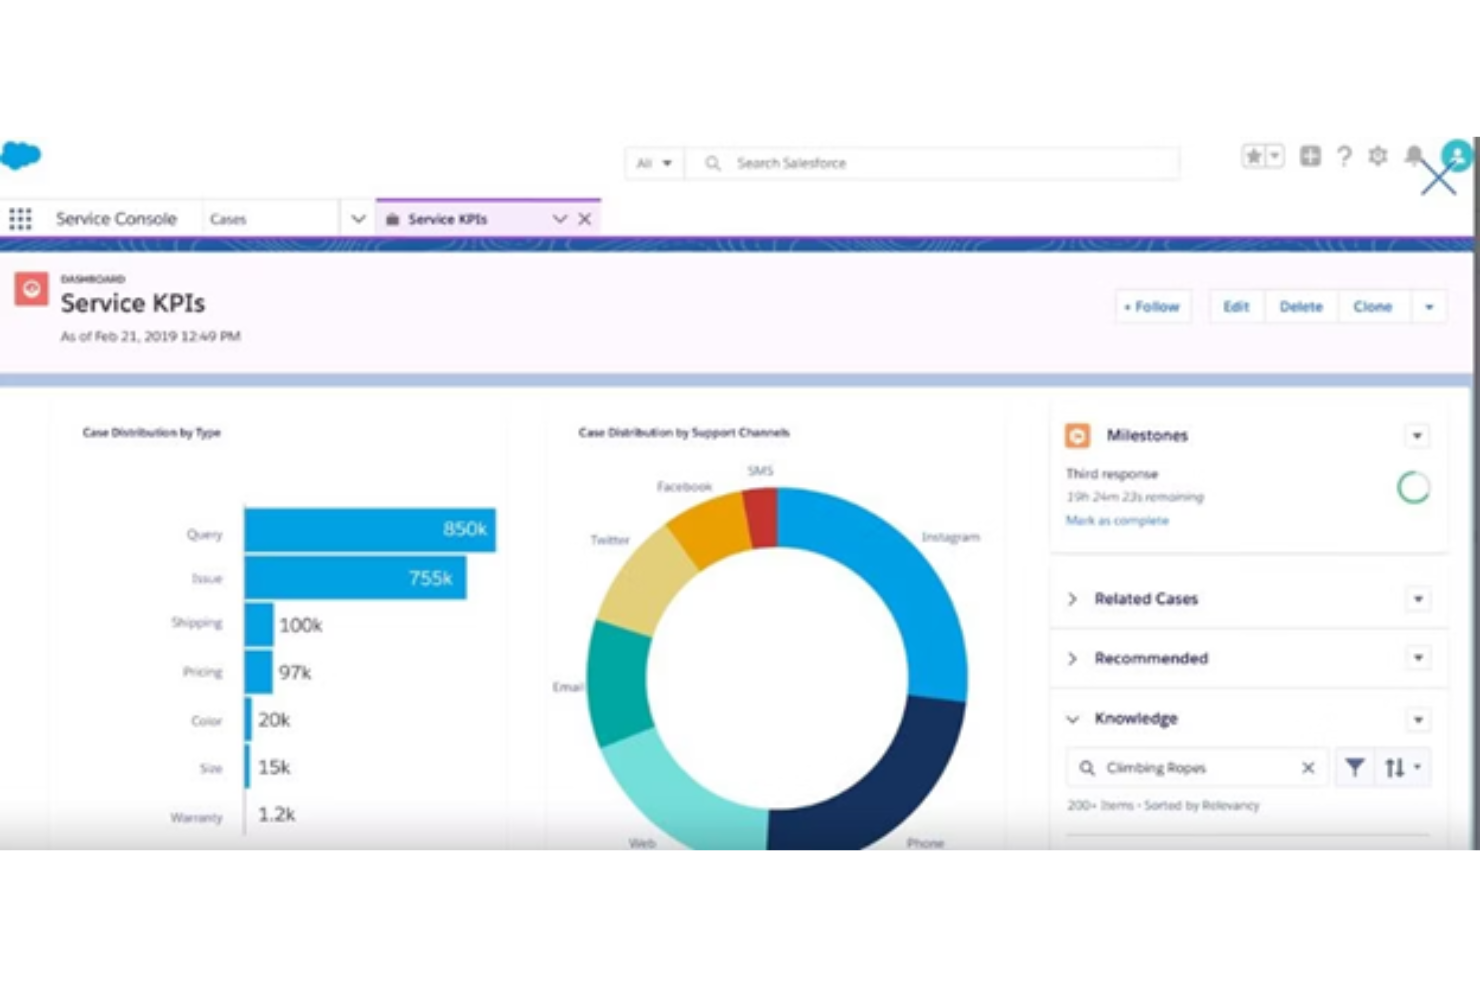
As an artificial intelligence-driven BI platform, Salesforce Einstein Analytics delivers a feature-rich data visualization and analysis solution with end-to-end capabilities. Utilize the power of AI to analyze billions of data combinations across marketing, service, and sales for smarter, faster decision-making.
Why I picked Einstein Analytics Platform: This tool made my list because it has a feature called Einstein Actions. Now, you can take action more quickly the moment you gain a new insight with built-in functionality for creating tasks, sharing insights, and updating records without having to wait for legacy technology to catch up.
Einstein Analytics Platform Standout Features and Integrations
Standout features include a mobile-first approach that makes Einstein accessible on any device, even smart watches, and contextual dashboards through Tableau to embed visualizations across the platform.
Integrations include Accounting Seed, Conga Grid, Oracle, RollUp Helper, SAP, SurveyMonkey, Tableau, Viostream, Wave, and Whatfix.
Pros and cons
Pros:
- Friendly and accessible customer support
- Easy to set up using a “Trailhead”
- Designed to be versatile across various industries
Cons:
- Limited data that you can use
- Requires a limited analytics license
Best for versatile implementation on-premise or in the cloud
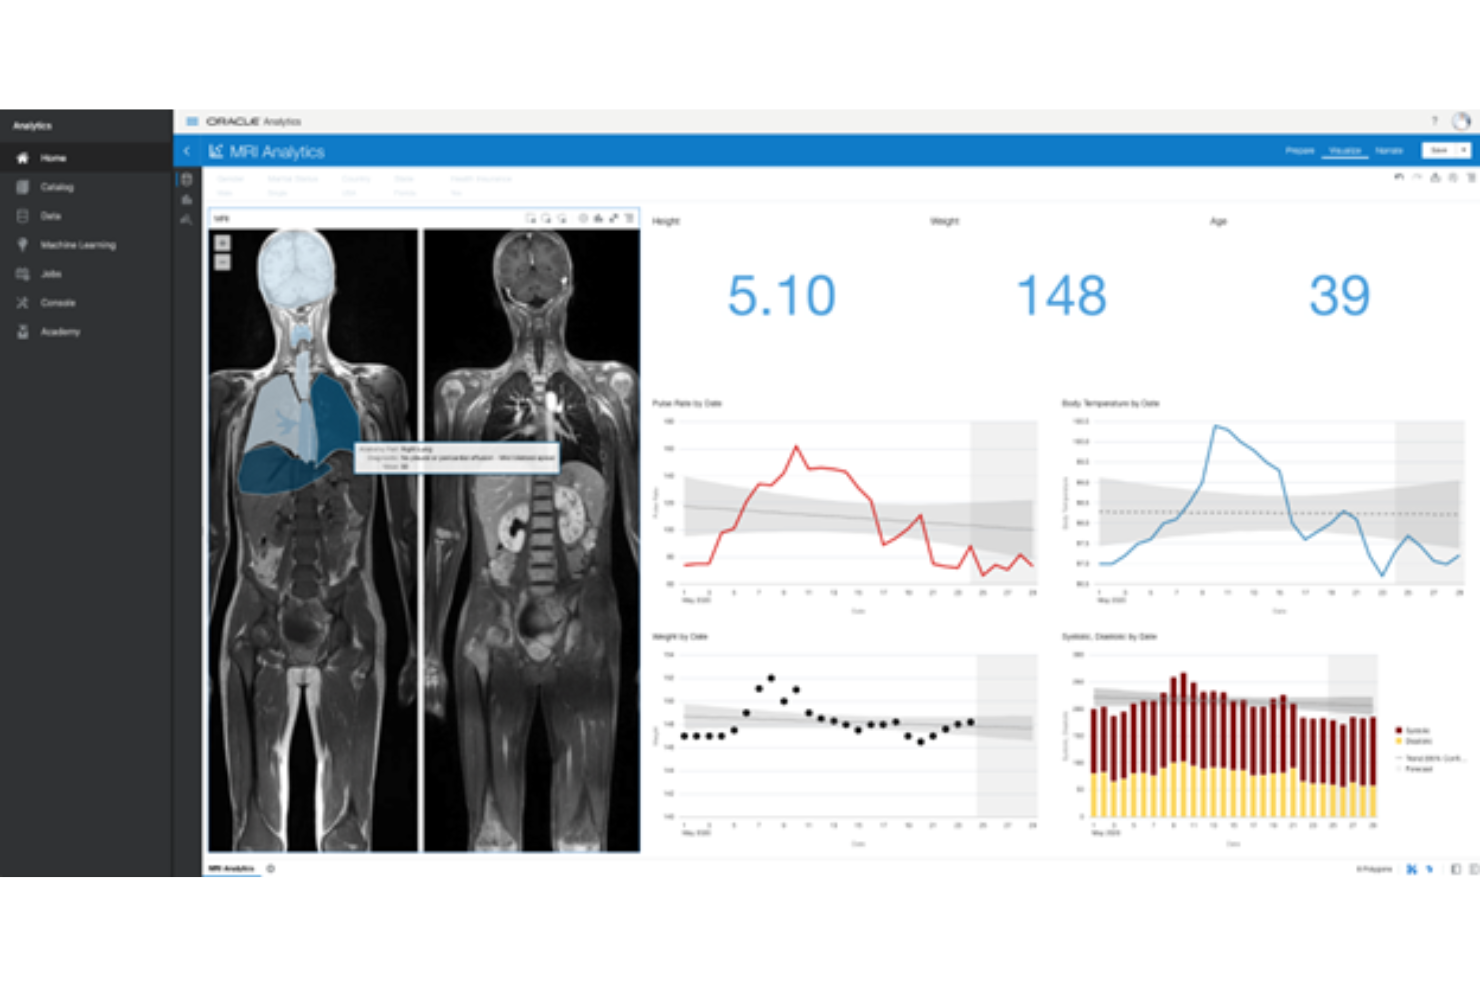
This cloud native BI service is designed to help your organization discover and unlock actionable insights from your data through powerful data preparation and enrichment, as well as data visualization and embedded machine learning. Oracle Analytics Cloud provides on-premise, cloud, and hybrid deployment strategies.
Why I picked Oracle Analytics Cloud: I like this platform because it offers flexible implementation options to meet your needs. While many smaller businesses that can’t afford hardware costs may prefer cloud implementation, enterprise organizations who prefer more control over their data can opt for on-premise deployment.
Oracle Analytics Cloud Standout Features and Integrations
Standout features include machine learning capabilities to surface hidden insights, autonomous data warehouse to optimize analytic workloads, and a mobile app that can learn from your behaviors and make recommendations.
Integrations include Accountagility ORYX, DataTerrain, Espresso, iOS14, Kodiak Hub, Microsoft Azure, Microsoft PowerPoint, Rayven, TSM, and VKS.
Pros and cons
Pros:
- User-friendly interface design
- Very accessible with limited coding requirements
- You need minimal training to use it
Cons:
- Limited scaling up and down instances
- Limited customization options
| Tools | Price | |
|---|---|---|
| Alteryx | From $80/user/month | Website |
| Domo | Pricing upon request | Website |
| Looker | From $5,000/month | Website |
| MicroStrategy | Pricing upon request | Website |
| Networked BI | Pricing upon request | Website |
| AnswerRocket | Pricing upon request | Website |
| Qlik Analytics Platform | From $20/user/month for a 10 user minimum | Website |
| Pyramid Analytics | Pricing upon request | Website |
| Einstein Analytics Platform | From $75/user/month | Website |
| Oracle Analytics Cloud | From $162.30/month for up to 10 users | Website |
Compare Software Specs Side by Side
Use our comparison chart to review and evaluate software specs side-by-side.
Compare SoftwareOther Options
I’m a bit of an overachiever, and I just couldn’t complete this list without at least mentioning these other powerful BI options, including:
Selection Criteria For Self-Service BI Tools
Here’s a short summary of the main selection and evaluation criteria I used to develop my list of the best self-service BI tools for this article:
Core Functionality
As a self-service solution, the BI platforms on this list need to have slightly different functionality than more traditional BI solutions, including:
- Easy-to-use interface to quickly explore, analyze, and build
- Single source of truth to provide accurate data sets for every need
- Updates and analysis in real-time for quicker decision-making
- Limited need to invest in additional hardware for less overhead
Key Features
To deliver on the core functionalities that I’ve listed above, you’ll see that most of the tools on my list have similar key features, including:
- Drag-and-drop editing: Instead of needing to code in order to create reports or organize dashboards, your team can simply click to drag the charts and graphs they need and drop them into place.
- Data visualizations: Visualizations are an essential part of BI tools because they make data more digestible for the layman. Whether it’s graphs, pies, or charts, most of these tools allow you to customize your creations.
- Data storytelling: Another tool for translating data analysis, this feature interprets complex information as a narrative that adds value to your reports and presentations by highlighting key points for your stakeholders.
- Predictive analytics: This type of data analytics is based on historical data, using it to forecast future trends in customer behavior, market change, and other potential industry scenarios so you can plan ahead.
- Dashboards and reporting: To ensure your team isn’t building new reports or customizing dashboards from scratch, BI tools provide editable templates you can embed nearly anywhere.
- Cloud-based accessibility: This feature is designed to provide expanded accessibility to your team so they can connect to your BI tools on any device from anywhere with an internet connection. You also don’t need to provide on-premise hardware for storage.
- Data mining capabilities: Specifically built to identify patterns and correlations throughout large volumes of raw data, this feature runs automatically using clustering algorithms and neural networks to unearth new insights.
Usability
Since self-service is the driving motivation behind BI tools, making them as usable as possible is a priority. In addition to drag-and-drop functionality, user-friendly interfaces, and visual data interpretations, most of these tools offer intuitive navigation, guided onboarding, and a knowledgeable customer support team that can get you up and running in no time.
Software Integrations
Since data is king, you’ll need software that can integrate with the other tools in your tech stack, such as your CRM or ERP. Through these integrations, your BI tools can leverage even more data from existing data stores for up-to-date insights. I’ve listed the most popular integrations for each platform above.
Pricing
The cost of self-service BI tools will vary depending on the specific features you need. You can expect to spend anywhere from $75/user/month to $3,000/user/month. Most tools offer monthly subscriptions, but there are some that operate on a yearly subscription or one-time licensing fee.
Basic analytics capabilities with bare-bones functionality are ideal for solo users or small businesses just learning how to use BI. If you’re looking for enhanced features, like machine learning algorithms or natural language processing (NLP), you can expect a much higher price tag.
People Also Ask
If you have a few more questions about BI tools, I can help you learn more with answers to the most commonly asked questions.
What are the benefits of self-service BI tools?
There are a number of benefits to using self-service BI tools, not the least of which is data democratization. Here are a few other benefits for business users:
- Increased speed: These tools have made it much easier and faster to explore data on your own by leveraging artificial intelligence and no-code functionalities.
- More accessibility: Cloud-based tools become a single source of truth anyone in your organization can rely on, with compatibility on nearly any device.
- Fewer manual demands: You can expect tons of automation and machine learning features that cut down on the need for manual data entry and report building.
- Higher security: BI tools come with built-in security and permissions controls to protect sensitive data from unauthorized access.
- Scalability: Implementing these tools is pretty easy, even with a limited budget. Most tools can scale with your organization without additional infrastructure investment.
Who uses self-service BI tools?
Many people in your organization may end up using BI tools as part of their job, including:
- IT Specialists use BI tools to process large data sets and generate reports
- Data Scientists rely on BI tools to find insights and build predictive models
- Executives can use BI tools to get an overview of performance and operations
- Analysts need BI tools to better understand consumer behaviors and market trends
- Sales Professionals can gain insights into trends to build better sales strategies
- Marketing Teams can analyze the effectiveness of their campaigns to optimize them
What is business intelligence?
Simply put, business intelligence is the collection of technology and strategies you use to analyze data and manage business information. Some of these tools can be as simple as spreadsheets and reporting software or as complex as OLAP and data mining tools.
Other Revenue Operations Software
If you’re looking for other intelligence platforms to drive revenue operations needs, check out this roundup of my favorite tools:
- Revenue Intelligence Platforms
- Lead Intelligence Software
- Sales Intelligence Software
- Cloud BI Tools
- Business Development Software
- Sales Analytics Software
Next Steps
It may take you some time to sort through the best BI tools for your business, but once you’ve narrowed down your own list, make sure to sign up for those trials and demos to see how these platforms perform in the context of your business.
And if you want consistent updates and insights from the experts, make sure to sign up for the RevOps newsletter to get reports directly to your inbox.


